
Figure 2:
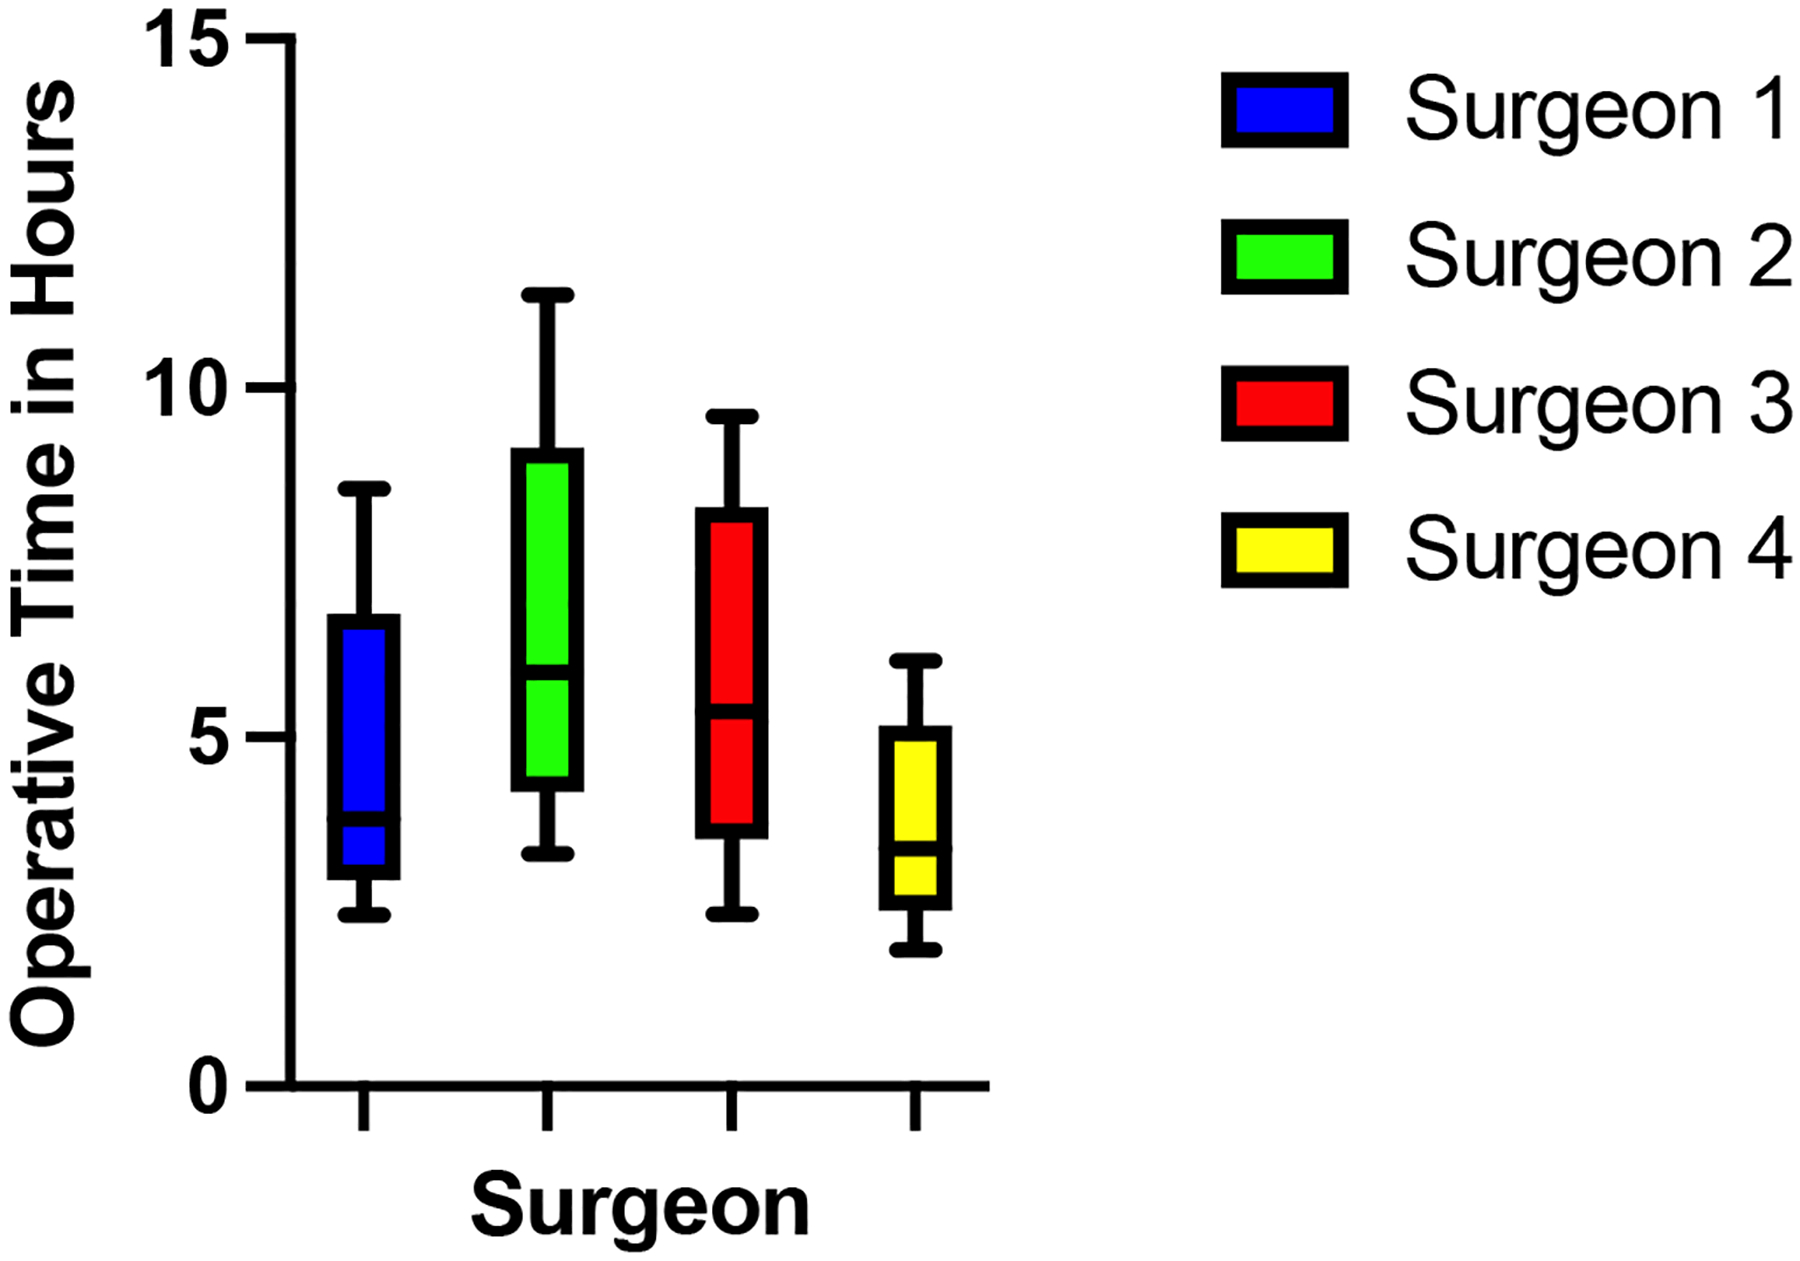
Box and whisker plot of the variability of each surgeon’s operating time. The whiskers represent minimum and maximum values. The box represents median, first and third quartile of operating times.
Official websites use .gov
A
.gov website belongs to an official
government organization in the United States.
Secure .gov websites use HTTPS
A lock (
) or https:// means you've safely
connected to the .gov website. Share sensitive
information only on official, secure websites.
Box and whisker plot of the variability of each surgeon’s operating time. The whiskers represent minimum and maximum values. The box represents median, first and third quartile of operating times.