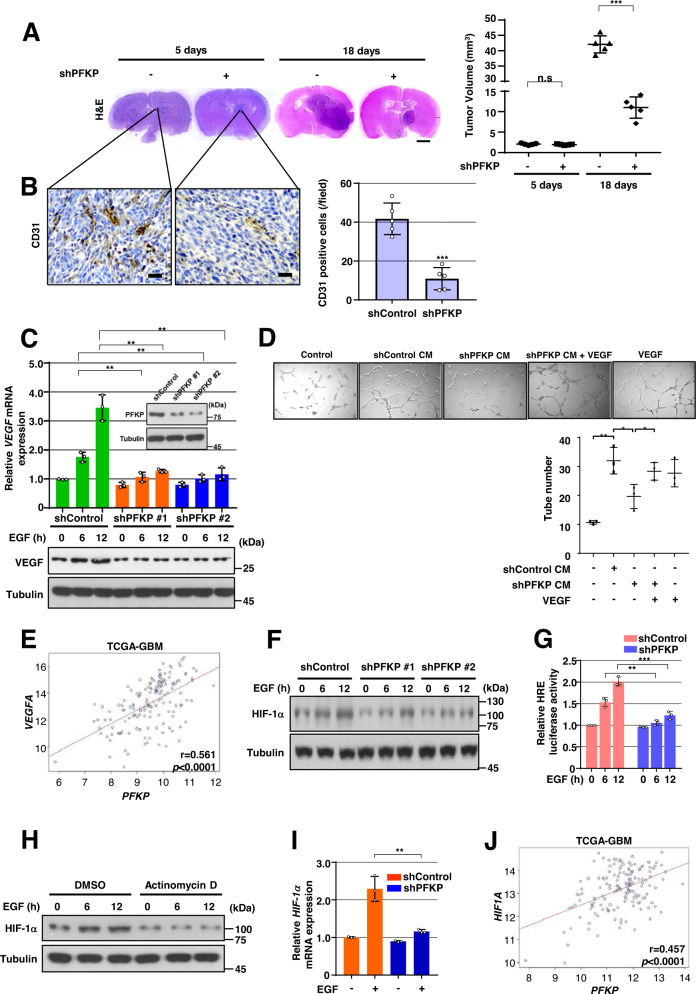
Fig. 1. PFKP expression is required for EGFR activation-induced VEGF expression in vitro and GBM angiogenesis in vivo.
WB and qRT-PCR were performed with indicated primers and antibodies, respectively (C, F, H, I). A, B Representative H&E staining images of intracranial xenografts bearing LN229/EGFRvIII cells stably expressing with or without PFKP shRNA (A; left panel) and quantification of tumor volumes (A; right panel). IHC analyses of the tumor tissues with an anti-CD31 antibody (B; left panel). Quantification of CD31 (B; right panel). Scale bar, 2 mm (A) and 100 μm (B). C GSCs with different shRNAs against PFKP (inside panel). Serum-starved GSCs with or without PFKP depletion were treated with EGF (100 ng/mL). D HUVECs were treated with or without a conditioned medium (CM) from control shRNA-expressing or PFKP shRNA-expressing LN229/EGFRvIII cells in the presence or absence of VEGF (20 ng/mL). HUVECs tube formation was observed. Representative images were acquired under an optical microscope (50×), and the tube number (/field) was quantified. E TCGA analysis of PFKP and VEGF mRNA expression from TCGA-GBM data (n = 154). F Serum-starved GSCs with or without PFKP depletion were treated with EGF (100 ng/mL). G HRE luciferase activity in GSCs with stable expression of control shRNA or PFKP shRNA was measured. H Serum-starved GSCs were pretreated with DMSO or actinomycin D (1 μg/mL) for 1 h and then stimulated with or without EGF (100 ng/mL). I Serum-starved GSCs stably expressing control shRNA, or PFKP shRNA were treated with or without EGF (100 ng/mL) for 12 h. J TCGA analysis of PFKP and HIF-1α mRNA expression from TCGA-GBM data (n = 154). Data are presented as mean ± standard deviation of three independent experiments (A, C, D, G, I). ***P < 0.001, based on the Student’s t-test.

