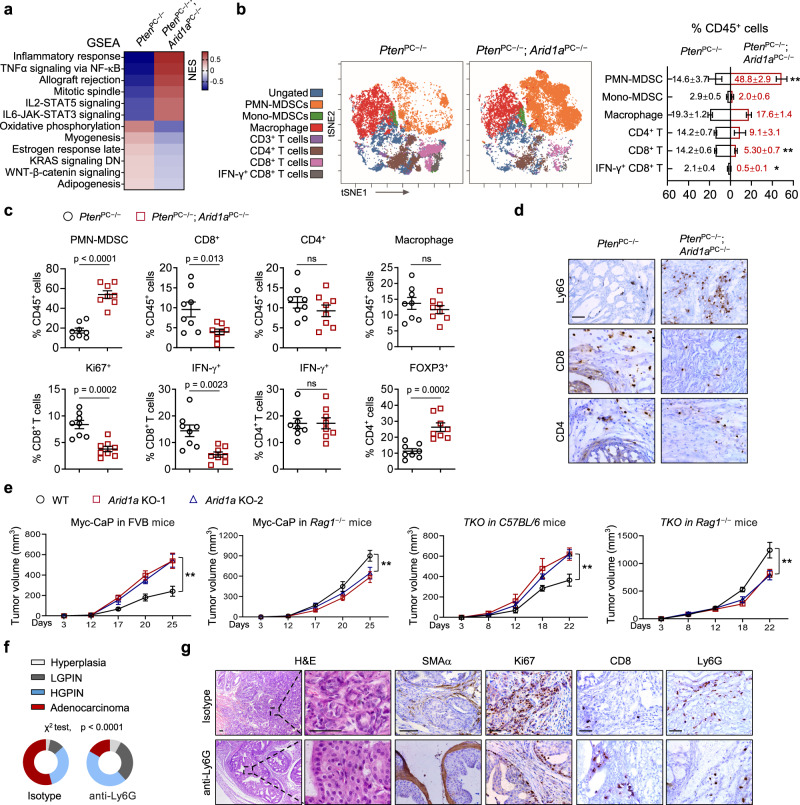
Fig. 2. Arid1a loss produces an immunosuppressive TME via the induction of PMN-MDSC recruitment.
a GSEA revealed the top 6 upregulated and downregulated hallmark pathways in the prostate epithelium from 3-month-old PtenPC−/− and PtenPC−/−; Arid1aPC−/− prostate tumors. b Immunoprofiling and quantification of 3-month-old PtenPC−/− and PtenPC−/−; Arid1aPC−/− prostate tumors by CyTOF (n = 3). Exact p-values between the indicated tumors for PMN-MDSCs (p = 0.002), CD8+ T cells (p = 0.0006), IFN-γ+ CD8+ T cells (p = 0.0188). c Quantification of the indicated tumor-infiltrating immune cell populations by FACS analysis (n = 8). d IHC analysis for CD4+, CD8+, and PMN-MDSCs (Ly6G). Scale bars, 50 μm. e Tumor volume of WT and Arid1a KO cells subcutaneously injected into immunocompetent mice (FVB or C57BL/6) or Rag1−/− mice. For Myc-CaP in FVB mice, WT or Arid1a KO-1 (n = 6, each group), Arid1a KO-2 (n = 5), WT vs Arid1a KO-1 or KO-2 (p < 0.0001); for Myc-CaP in Rag1−/− mice, n = 5 for each group, WT vs Arid1a KO-1 (p < 0.0001), WT vs Arid1a KO-2 (p = 0.0007); for TKO in C57BL/6 mice, WT or Arid1a KO-1 (n = 6, each group), Arid1a KO-2 (n = 7), WT vs Arid1a KO-1 (p = 0.0004), WT vs Arid1a KO-2 (p = 0.0002); for TKO in Rag1−/− mice, WT or Arid1a KO-2 (n = 7, each group), Arid1a KO-1 (n = 6), WT vs Arid1a KO-1 or KO-2 (p < 0.0001). f Quantitation of the tumor histopathology in isotype- or Ly6G antibody-treated PtenPC−/−; Arid1aPC−/− prostates starting when mice were 10-week-old and treatment was administered for 4 weeks (n = 6). g H&E and IHC staining for SMAα, Ki67, CD8 and Ly6G in mouse prostates with or without anti-Ly6G antibody treatment. Scale bars, 50 μm. b, c, e, Data represent the mean ± SEM. Statistical significance was determined by two-tailed unpaired t-test (b, c), two-way ANOVA followed by multiple comparisons (e) and χ2-test (f). b, d, g Representative data of triplicate experiments are shown. Source data are provided as a Source Data file. *p < 0.05, **p < 0.01, ns, no significance.

