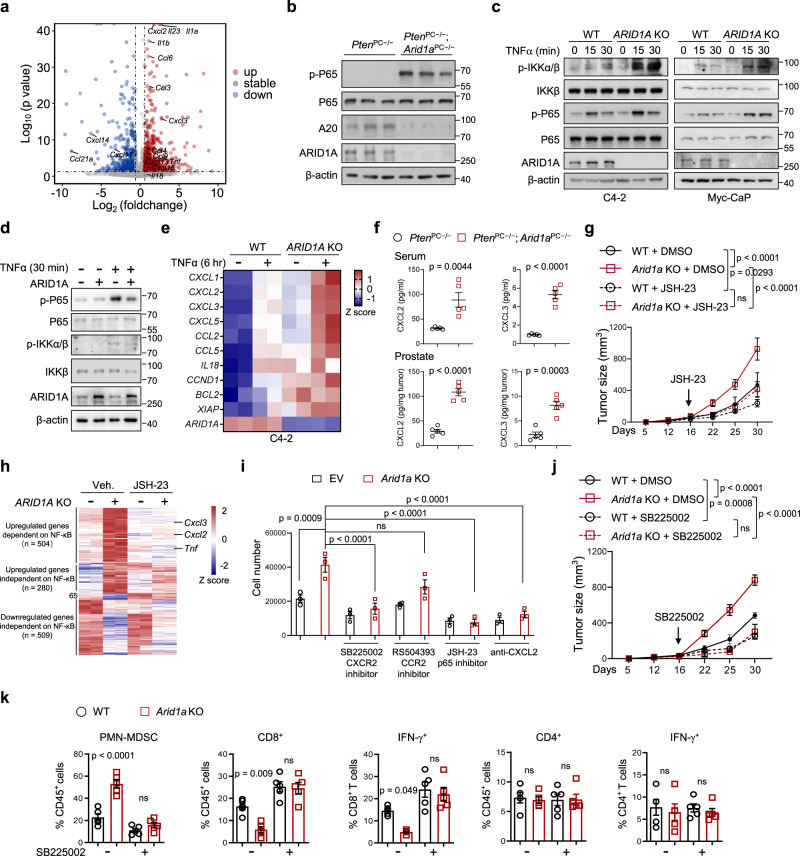
Fig. 3. Hyperactivation of NF-κB in ARID1A-depleted tumors causes the excess recruitment of MDSCs.
a Volcano plots showing the differentially expressed genes (DEGs) between epithelial cells of 3-month-old PtenPC−/−; Arid1aPC−/− versus PtenPC−/−mouse prostates (n = 3). The upregulated and downregulated cytokines and chemokines are indicated. p-value was determined by DEGseq analysis. b IB analysis of the indicated protein in 3-month-old mouse prostates. c IB analysis of WT and ARID1A-depleted C4-2 and Myc-CaP cells treated with TNFα at the indicated time points. d IB analysis in WT and ARID1A-overexpression Myc-CaP cells with or without TNFα stimulation. e Heatmap summarizing the qRT-PCR results in WT and Arid1a KO cells with or without TNFα stimulation. f ELISA of CXCL2 and CXCL3 in serum and prostate tumors of 3-month-old mice (n = 5). g Tumor volume of Myc-CaP expressing sgARID1A or control vector subcutaneously inoculated into FVB mice with or without JSH-23 treatment (WT + DMSO, n = 5; Arid1a KO + DMSO, n = 7; WT/Arid1a KO + JSH-23, n = 6). h Epithelial cells in xenografts (g) were sorted for RNA-Seq and DEGs between WT and Arid1a KO epithelium were shown in heatmap (n = 2). i Migration of PMN-MDSCs recruited by conditional mediums (CMs) with the indicated treatments (n = 3). j, k Mice were inoculated with WT or Arid1a KO Myc-CaP cells and treated with or without SB225002. Tumor volume was monitored (j, WT + DMSO, n = 5; Arid1a KO + DMSO, n = 7; WT/Arid1a KO + JSH-23, n = 6) and quantification of each tumor-infiltrating immune cell population (k, n = 5) were measured by FACS analysis. f, g, i–k Data represent the mean ± SEM. Statistical significance was determined by two-tailed unpaired t-test (f, i, k) and two-way ANOVA followed by multiple comparisons (g, j). b–d Data were evaluated in triplicate, and representative data are shown. Source data are provided as a Source Data file. ns, no significance.

