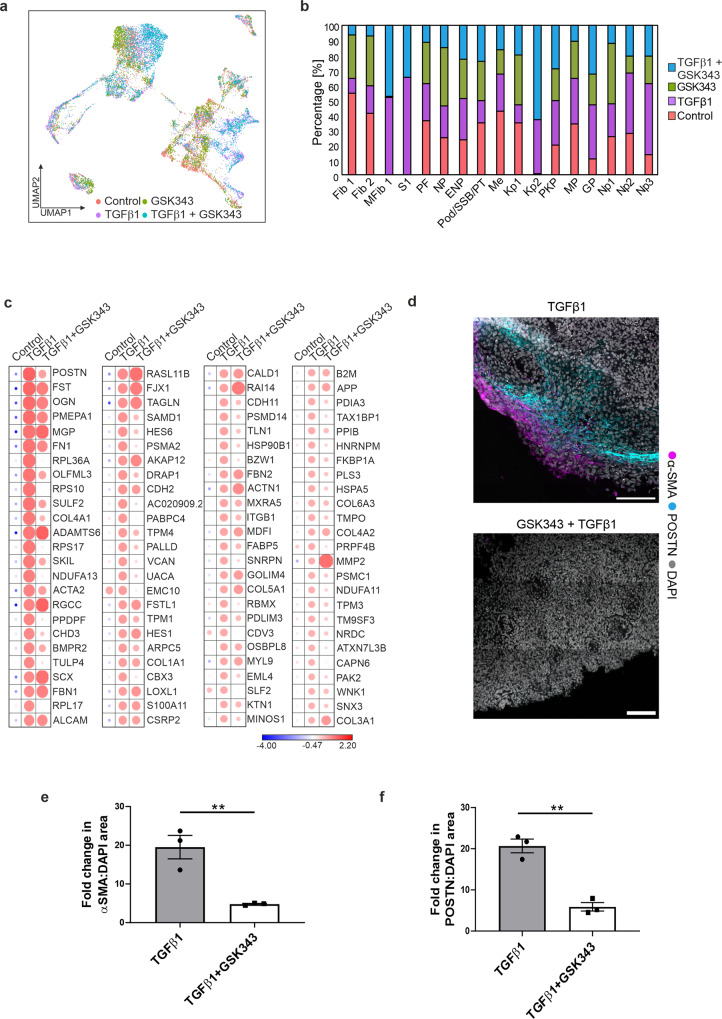
Fig. 4. GSK343 attenuates a subset of TGFβ1-induced fibrotic gene expression.
a Integrated UMAP of scRNAseq data for all conditions. b Bar chart depicting the percentage of cells per cluster in each sample. c Scaled gene expression for MFib1 in control, TGFβ1, and TGFβ1 + GSK343 treated organoids. d Organoids were pre-treated with the EZH2 inhibitor GSK343 for 1 h prior to treatment with TGFβ1 for 48 h. Immunostaining of αSMA and periostin (POSTN) in TGFβ1−, and TGFβ1 + GSK343-treated organoids. Scale bar 150 µm. Images are representative of three independent experiments. e αSMA/DAPI area and f POSTN/DAPI area in TGFβ1 and TGFβ1 + GSK343 treated organoids. Each symbol represents the mean of 18 randomly imaged fields, taken from one organoid per condition, from three independent experiments. Data are presented as the mean ± SEM. **P ≤ 0.01 (αSMA/DAPI area = P ≤ 0.0083; POSTN/DAPI area = P ≤ 0.0017).

