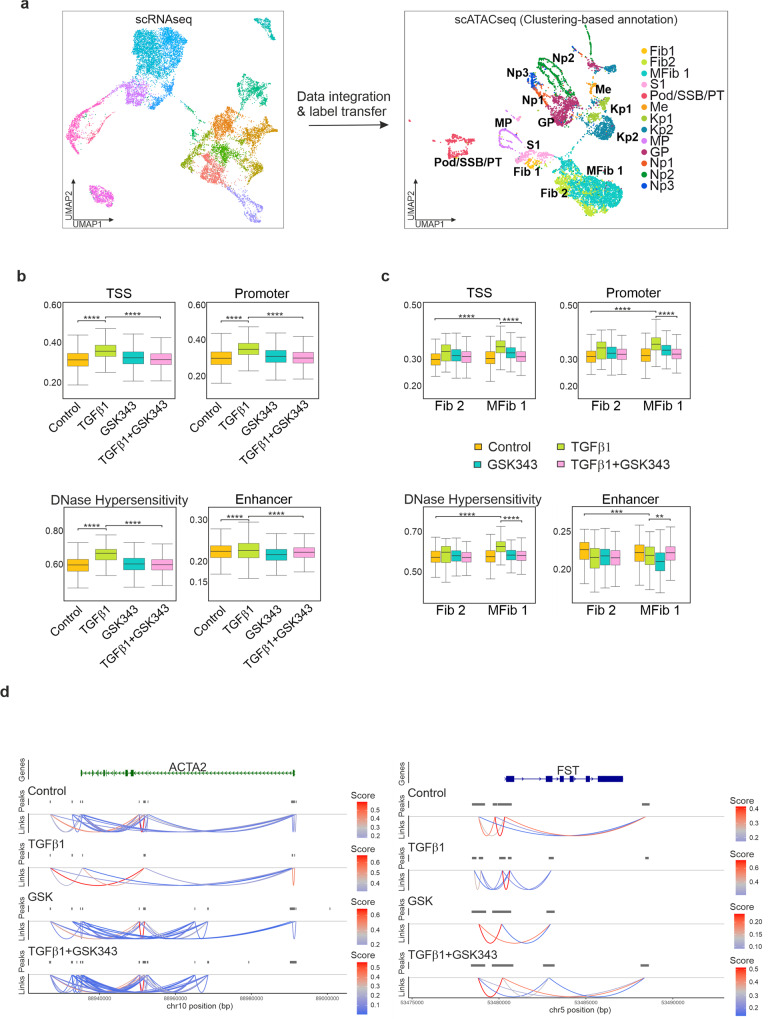
Fig. 5. Integration of single cell RNA-seq and ATAC-seq identifies open chromatin regions and increased accessibility in response to TGFβ1.
a Multi-omics integration strategy for processing the scATACseq dataset. Annotated clusters in the scRNAseq dataset were used to predict cell types in the scATACseq dataset. UMAP plot of scATACseq dataset with gene activity-based cell type assignments. b Global changes in chromatin accessibility at Transcription Start Site (TSS), promoters, enhancers, and DNase I hypersensitivity sites. ****P ≤ 0.0001, pairwise t-test with Bonferroni correction. c Changes in chromatin accessibility at Transcription Start Site (TSS), promoters, enhancers, and DNase I hypersensitivity sites in response to TGFβ1 in Fib2 and MFib1 is inhibited by GSK343. **P ≤ 0.01; ***P ≤ 0.001; ****P ≤ 0.0001; pairwise t-test with Bonferroni correction. d Prediction of cis co-accessibility networks (CCAN) at sample loci in response to TGFβ1 and GSK343. Higher co-accessibility score (red) indicates higher co-accessibility between promoter and enhancer elements.

