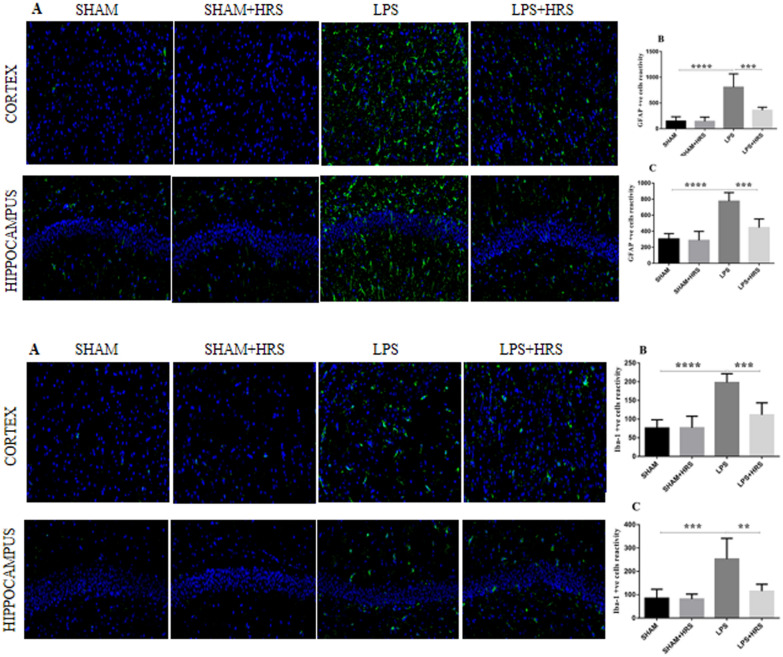
Fig. 5.
HRS treatment attenuated astrocyte and microglial activation in cerebral cortex and hippocampus of septic rats 48 h after LPS induction. Photographs represent astrocyte and microglial activation showing immunoreactivity of GFAP (top diagram) and IBA-1 (bottom) in cerebral cortex and hippocampus, respectively. Scale bar = 50 μm. A, B statistical representation of GFAP and IBA-1 showing the mean number of immunoreactive cells in cerebral cortex and hippocampus in each group, respectively (n = 6). All data are presented as mean ± SD ****p < 0.0001, ***p < 0.001, **p < 0.005. HRS Hydrogen-rich saline, LPS lipopolysaccharide, GFAP Glial fibrillary acidic protein, IBA-1 Ionised calcium binding adaptor molecule 1

