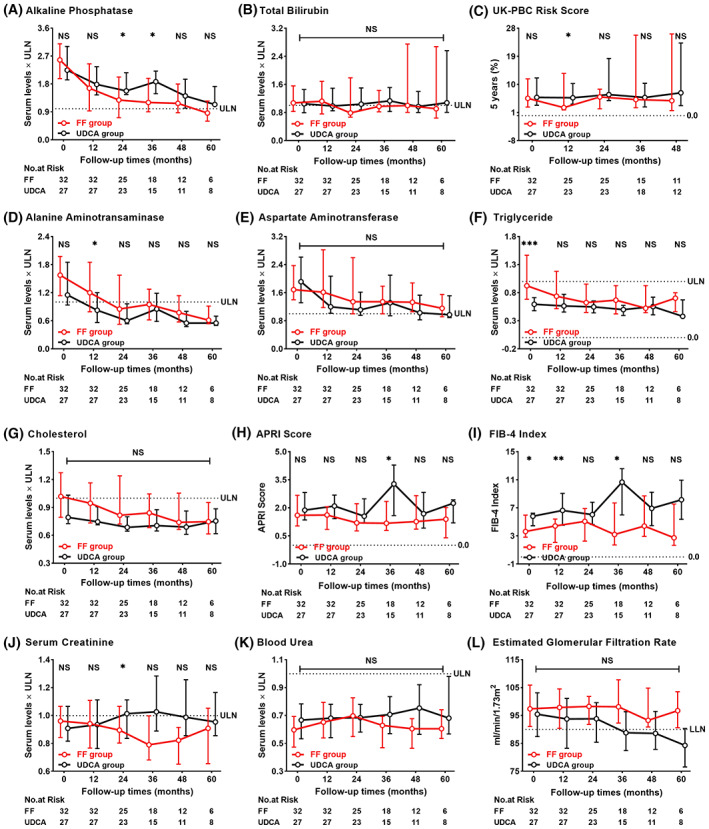
FIGURE 3.

Dynamic changes between the FF group and the UDCA group at each follow‐up visit. (A) Alkaline phosphatase, (B) total bilirubin, (C) UK‐PBC risk score, (D) alanine aminotransferase, (E) aspartate aminotransferase, (F) triglyceride, (G), cholesterol, (H) APRI score, (I) FIB‐4 index, (J) serum creatinine, (K) blood urea, and (L) estimated glomerular filtration rate. Shown are the median values and interquartile ranges. Data were compared by the Mann‐Whitney U test. APRI, aspartate aminotransferase‐to‐platelet ratio index; FF, fenofibrate; FIB‐4, fibrosis‐4; LLN, lower limit of normal; NS, not significant; UDCA, ursodeoxycholic acid; UK‐PBC, United Kingdom primary biliary cholangitis; ULN, upper limit of normal.
