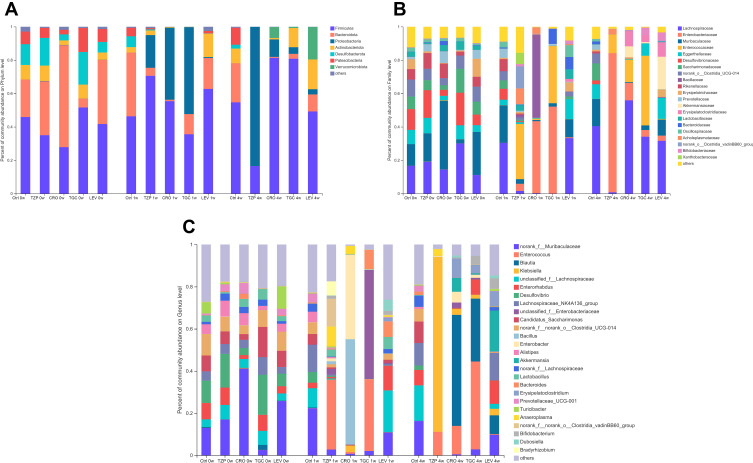
Figure 4.
Antibiotic-induced composition changes of gut microbiota. Distribution of the predominant bacteria with antibiotics-treated at (A) phylum level, (B) family level and (C) genus level on 0W, 1W and 4W. Species with less than 0.5% abundance in all samples were merged into the “Others” category. 0W: before treatment. 1 W and 4 W: 1 W and 4W after treatment.
Abbreviations: TZP, piperacillin/tazobactam; CRO, ceftriaxone; TGC, tigecycline; LEV, levofloxacin; Ctrl, control.

