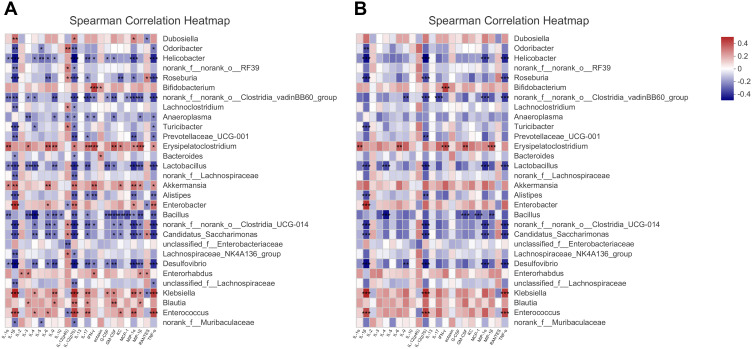
Figure 6.
Correlations microbiome compositions (at the top 30 genus level) and the 23 serum cytokine levels of host immune markers on 0W, 1W and 4W. (A) Significance thresholds included absolute correlation coefficients higher than 0.1 and P < 0.05. (B) Significance thresholds included absolute correlation coefficients higher than 0.3 and P < 0.05. The number in color present Spearman correlation coefficient: red color indicates positive correlation; blue color indicates negative correlation. *P < 0.05, **P < 0.01, ***P < 0.001.

