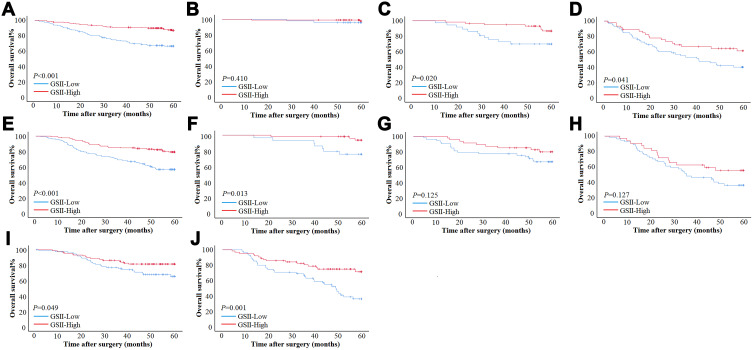
Figure 3.
Survival curve subgroup analyses of patients. (A–D) Survival curves of patients with ≤60 based on GSII in total stage, stage I, stage II and stage III in training cohort. (E–H) Survival curves of patients with >60 based on GSII in total stage, stage I, stage II and stage III in validation cohort. (I and J) Survival curves of patients with ≤60 and >60 based on GSII in overall patients in validation cohort.

