Fig. 2.
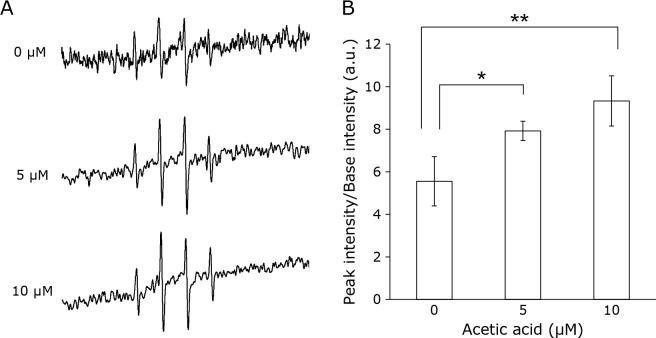
Intracellular ROS production in RGK1 cells after acetic acid treatment were measured by ESR. Cells were stimulated with each concentration of acetic acid for 1 h. (A) Representative ESR signals were shown. (B) The relative ratios of ESR signal intensities were shown. Error bars indicate SD (n = 3). *p<0.05, **p<0.01.

