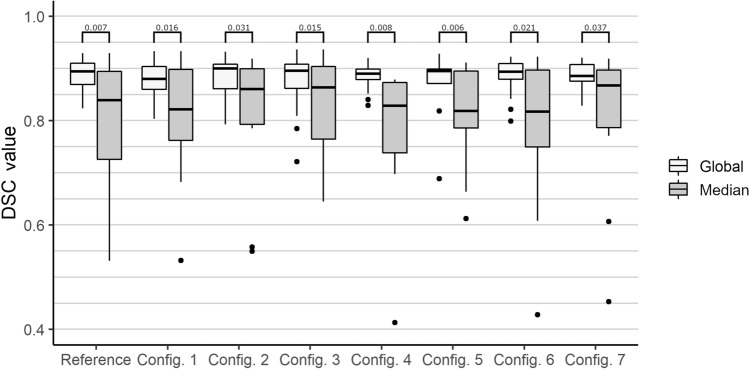
Figure 5.
Results of the robustness analysis. Configuration (Config.) 1–5 represent the variation of the number of orientations. Configuration 6 and 7 represent the variation of optimization parameters. Global = globally optimized threshold. Median = Median from the optimized thresholds of each of the eight image orientations. Horizontal lines indicate statistically significant post-hoc pairwise t-test results. No values are located below a DSC of 0.4.

