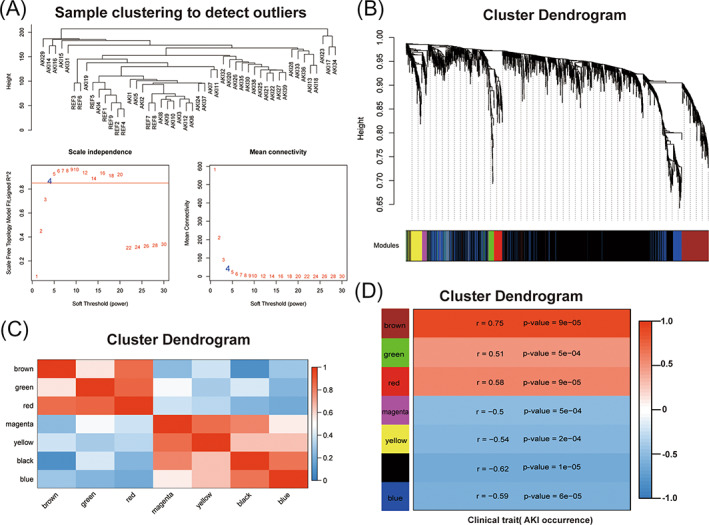
FIGURE 1.

WGCNA analysis of differentially expressed genes. (A) Cluster dendrogram of 48 kidney tissue samples, which contain 39 AKI samples and nine non‐AKI samples, and determination of the soft threshold (β = 4) of weighted co‐expression network; (B) Cluster dendrogram of differentially expressed genes to identify the clinically significant modules associated with the development of AKI; (C) Heatmap of the correlations among different modules; (D) Heatmap of the correlations between module eigengenes and clinical traits of AKI
