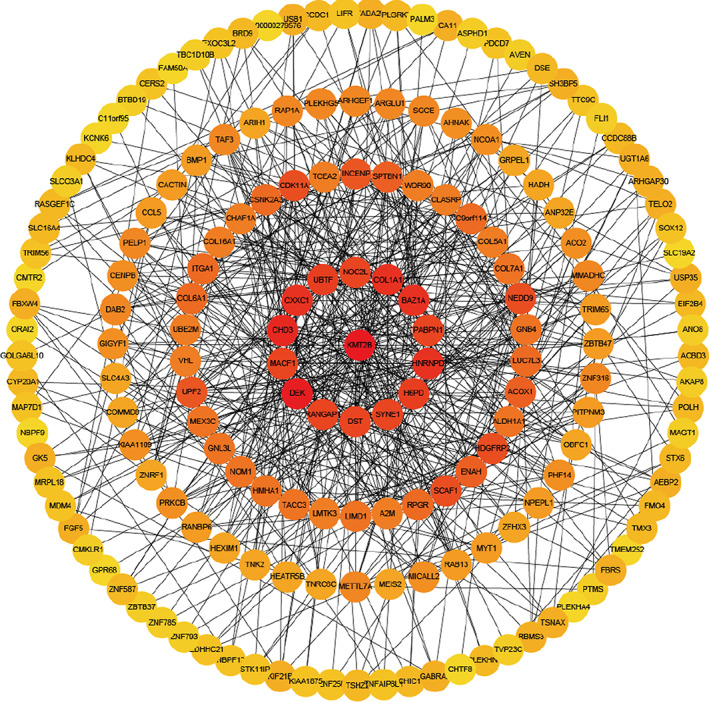
FIGURE 3.

PPI network analysis of DEGs to identify 15 hub genes (KMT2B, NOC2L, COL1A1, BAZ1A, PABPN1, HNRNPD, H6PD, SYNE1, DST, RANGAP1, DEK, MACF1, CHD3, CXXC1, and UBTF) of brown module. The high‐degree genes calculated by the CytoHubba plugin in Cytosacpe 3.5.1 were located in the center of the circle network and the dark color represented the high degree of genes.
