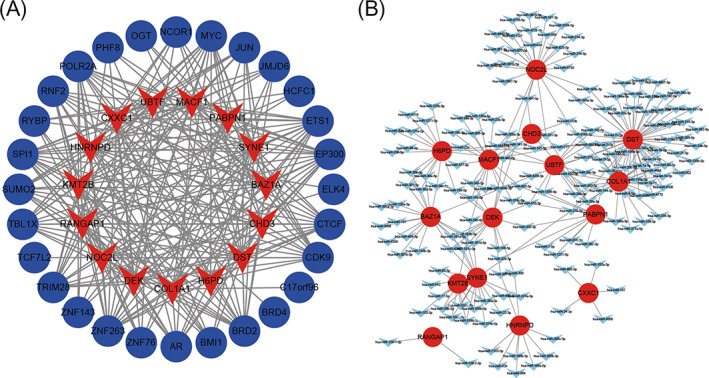
FIGURE 6.

Interaction network between 15 hub genes and target transcriptional factors. (A) the red nodes represent 15 hub genes and the blue nodes represent target transcriptional factors; (B) the interaction network between 15 hub genes and target miRNAs. The red nodes represent 15 hub genes and the blue nodes represent target miRNAs.
