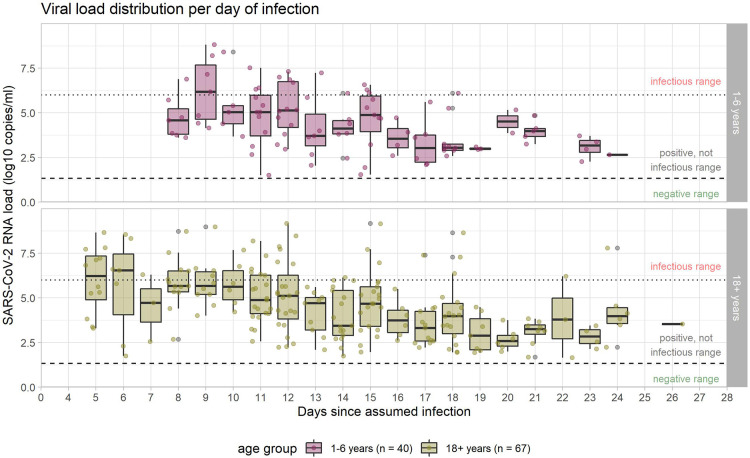
Figure 5.
Viral load in the course of infection. Medians are calculated for those samples which were available on the given days, and are indicated by midlines; the top and bottom edges of boxes represent the interquartile range (IQR). Whiskers indicate the upper and lower values. Dotted line marks the threshold for infectivity 10^6 RNA copies/ml (≙ CT 24.7 in our laboratory); dashed line marks the threshold for positivity with values >=10^1 RNA copies/ml (≙ CT 40 in our laboratory) considered as positive. Analysis restricted to samples considered positive (104 samples in 40 children, 214 samples in 67 adults) with increasingly fewer samples in the progression of the course of infection.

