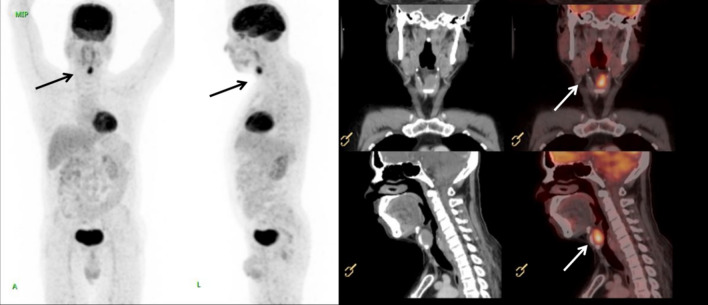
Fig. 2.
Computed tomography scan and Positron Emission Tomography—Computed Tomography scan showing FDG (fluorodeoxyglucose) avid soft tissue mass (marked by arrows) involving left false vocal cord, pre glottic fat plane, anterior commissure and anterior third of left true cord and invading the anterior half of left lamina of thyroid cartilage

