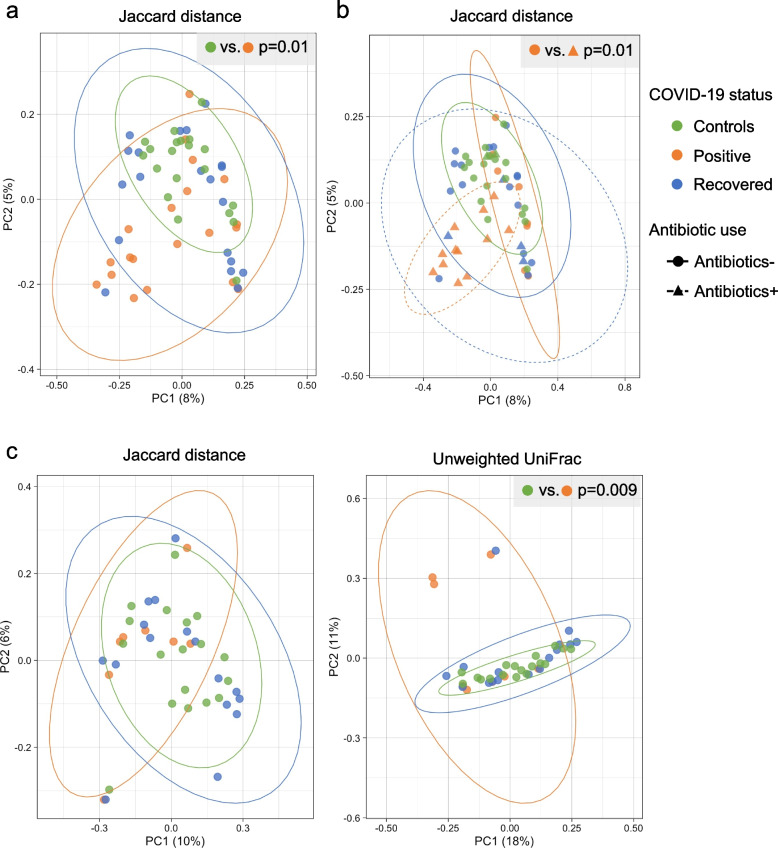
Fig. 2.
Gut microbial beta-diversity in three groups of study subjects, based on 16S rRNA sequences in fecal samples. In all panels, the ellipses represent 95% confidence intervals, and p-values were obtained by PERMANOVA. a, b Principal coordinates analysis (PCoA) was used for visualization of Jaccard dissimilarity of gut microbial communities between the Controls (n = 20), COVID-19-positive (n = 20), and COVID-19-recovered patients (n = 20). b Groups of subjects with or without antibiotic use were compared. c PCoA based on Jaccard distance and unweighted UniFrac distance are shown for subjects in the absence of recent antibiotic exposure. Table 1 indicates the number of subjects in each group

