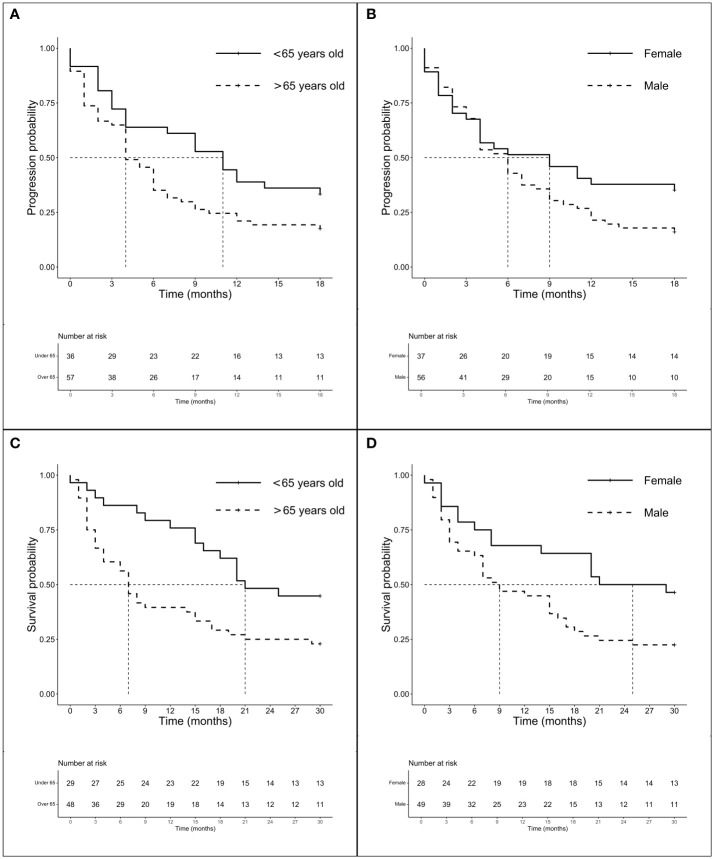
Figure 2.
Survival analysis (PFS and OS) according to age and gender. Survival analysis (PFS and OS) of G12 patients according to age (panels A and C) and gender (panel B and D). (A) mPFS of patients < 65 years (n = 62) vs. patients > 65 years (n = 119): 6.0 months (95% CI 4.0–11.0 months) vs. 4.0 months (95% CI 4.0–6.0 months), p = 0.518. (B) mPFS of female (n = 71) vs. male (n = 110): 6.0 months (95% CI 4.0–11.0 months) vs. 4.0 months (95% CI 3.0–6.0 months), p = 0.013. (C) mOS of patients < 65years (n = 56) vs. patients > 65 years (n = 109): 20.5 months (95% CI 10.0–NR months) vs. 13.0 months (95% CI 9.0–17.0 months), p = 0.007. (D) mOS of female (n = 63) vs. male (n = 102): 23.0 months (95% CI 18.0–NR months) vs. 14.5 months (95% CI 9.0–17.0 months), p = 0.004.

