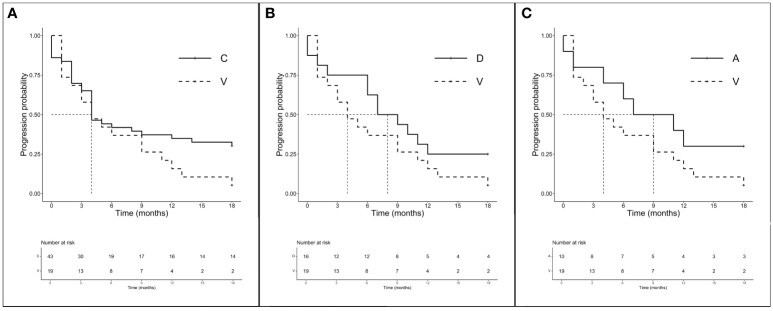
Figure 3.
PFS according to single amino acid substitutions in patients treated with ICI ± CT (n = 94). (A) mPFS C (n = 43) vs. V (n = 19): 4.0 months (95% CI 4.0–18.0 months) vs. 4.0 months (95% CI 3.0–12.0 months), p = 0.114. (B) mPFS D (n = 16) vs. V (n = 16): 8.0 months (95% CI 6.0–NR months) vs. 4.0 months (95% CI 3.0–12.0 months), p = 0.165. (C) mPFS A (n = 10) vs. V (n = 16): 9.0 months (95% CI 4.0–NR months) vs. 4.0 months (95% CI 3.0–12.0 months), p = 0.140.

