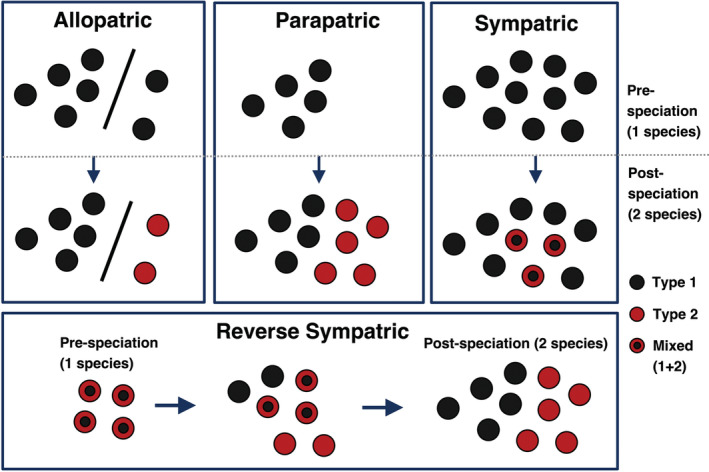
FIGURE 1.

Hypothetical examples illustrating different geographic modes of speciation over time. The three traditionally recognized modes are shown on top. The bottom row shows the reverse‐sympatric scenario discussed here. Each circle represents a population. All the three modes also include divergence in some trait over time, starting with all populations fixed for type 1. Under sympatric speciation, populations eventually have both types present in sympatry (mixed populations: black circle with red ring). Under the reverse‐sympatric model, populations begin with both the types present in sympatry (mixed), but these two types become geographically sorted over time into two parapatrically distributed species.
