FIGURE 5.

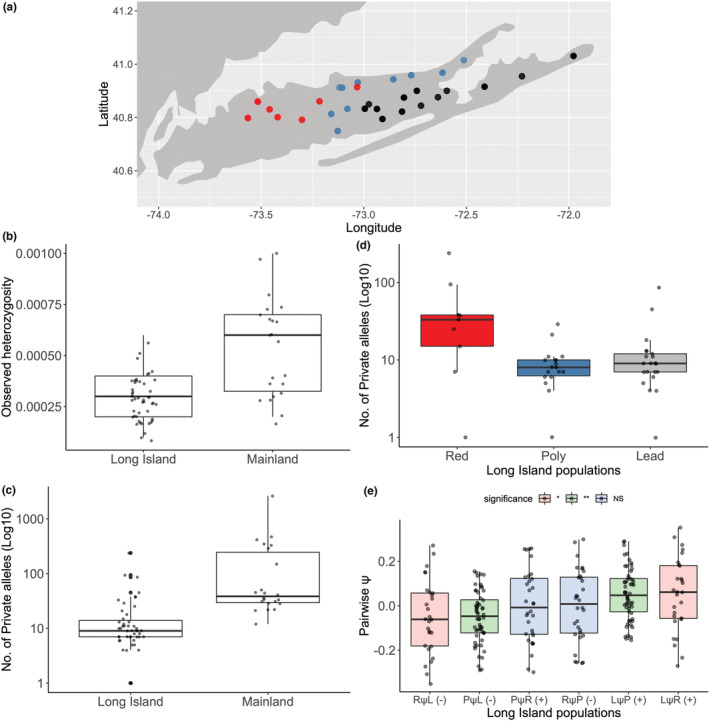
Results of analyses of heterozygosity, private alleles, and range expansion indices. (a) Distribution of Plethodon cinereus populations sampled across LI for heterozygosity and private‐allele analyses. Red dots indicate pure redback populations, black dots indicate pure leadback, and teal dots indicate polymorphic populations where both morphs occur. Sampling for range‐expansion analyses is shown in Figure 2. (b) Observed heterozygosity between individuals from Long Island (LI; n = 47) versus the mainland (n = 22). (c) Log10‐transformed number of private alleles in individuals from LI (n = 47) and the mainland (n = 22). (d) Number of private alleles among LI populations with different morphotype frequencies (Red = pure redback populations, n = 9; Poly = polymorphic populations, n = 18; Lead = pure leadback populations, n = 21). (e) Pairwise psi (ψ) statistics from the range‐expansion analyses. On the x‐axis, each category depicts comparisons where the population on the left of the ψ symbol was S 2 and the population to the right of the symbol was S 1; L = pure leadback populations; P = polymorphic populations; R = pure redback populations. Based on a hypothesis of range expansion from west to east, our expectations for whether pairwise mean ψ scores should be positive (+) or negative (−) is indicated in parentheses next to each x‐axis comparison category. Significant differences among pairwise mean ψ scores determined using the ANOVA and Tukey posthoc comparisons are indicated by boxplot colors (red = leadback‐redback comparisons; green = polymorphic‐leadback; blue = polymorphic‐redback) (*p = .026; **p = .003; NS, not significant).
