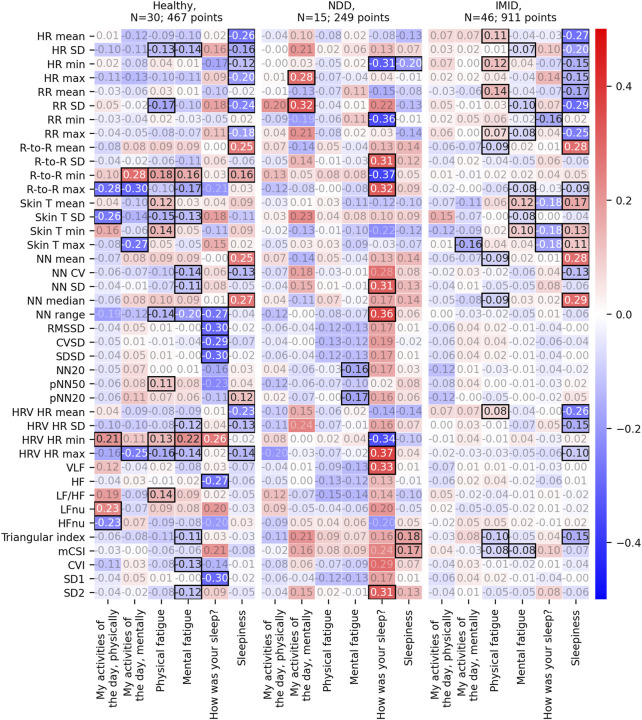
FIGURE 7.
Repeated measures correlation r values between the 2-h feature aggregates and the corresponding PROs. Here, the 2-h feature aggregates have been normalized with the participant-mean L5 parameters. Statistically significant correlation results (p-value<0.05) are emphasized with black borders, other r values have faded annotation.

