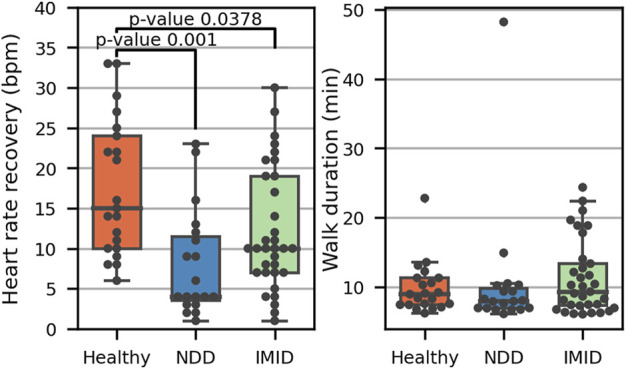
FIGURE 9.

Heart rate recovery (left) in the three participant groups, including one representative value for 21 healthy participants, 18 NDD (9 HD, 10 PD), and 33 IMID patients (11 IBD, 8 PSS, 8 RA, 6 SLE). The adjusted p-values from post hoc analysis with Tukey’s method indicate the significance of the differences. The total duration of each accepted walk leading to a 1-min resting period is presented on the right.
