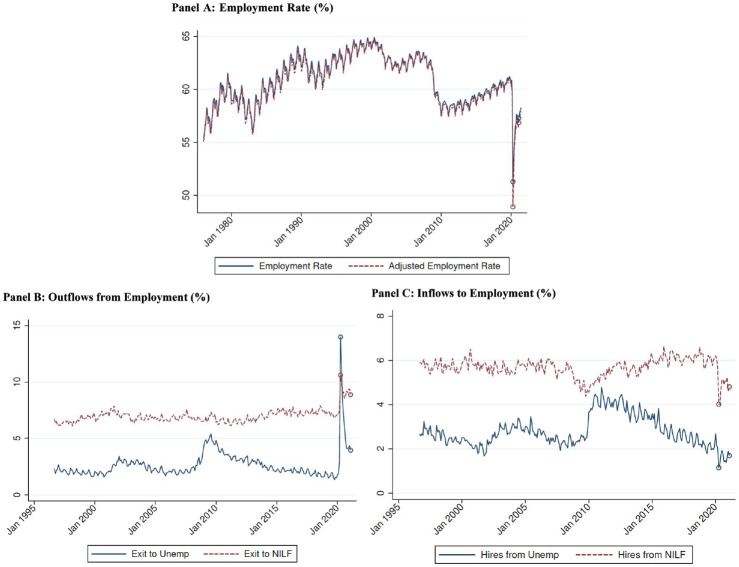
Figure 1.
Aggregate Employment Rate and Labor Market Flows
Notes: The figure plots monthly employment rates and year-on-year labor market flows (percentage of employed individuals who exit employment to non-employment, and percentage of non-employed individuals who become employed as a share of employment one year earlier) based on monthly CPS data. The adjusted employment rate excludes individuals who are classified as employed but were absent from work during the reference week for “other” reasons and report not being paid by their employer for their time off. These workers are instead classified as unemployed. The flow variables use the adjusted employment and unemployment classifications. The circles indicate data for April 2020 and February 2021. NILF, not-in-the-labor-force.

