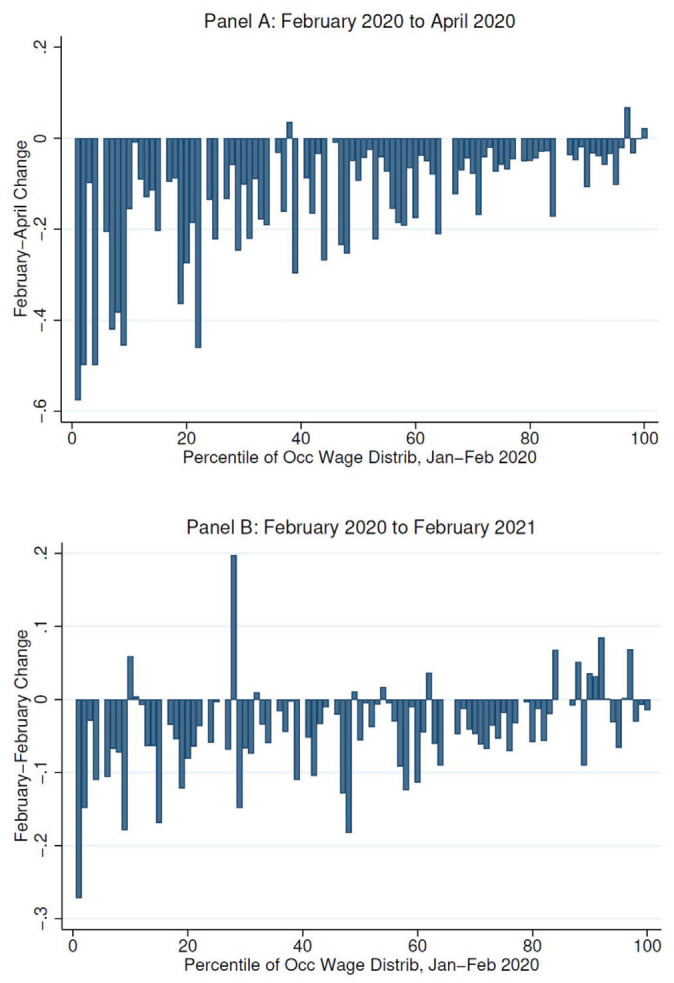
Figure 3.

Changes in Employment across 4-Digit Occupations (as a share of the total population) since February 2020
Notes: The figure plots change relative to February 2020 in employment rates (per capita) for occupations at each percentile of the employment-weighted occupational wage distribution (the assignment to percentiles is based on employment and wages in the pre-pandemic period of January and February 2020). Our employment measure excludes individuals who were absent from work during the reference week for “other” reasons and report not being paid by their employer for their time off.
