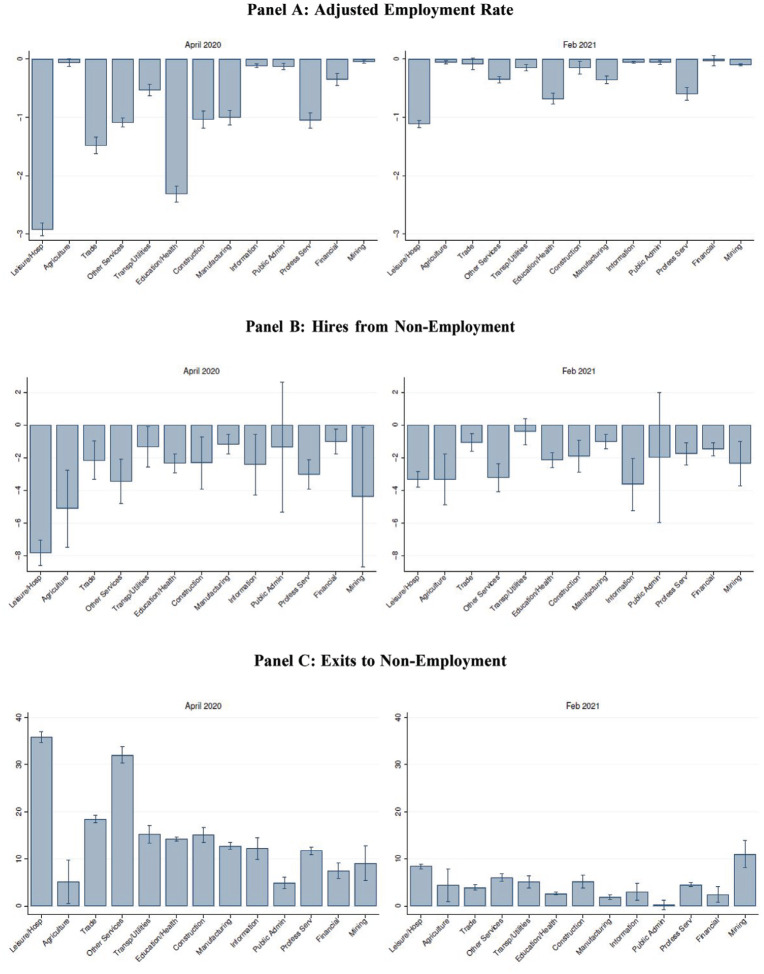
Figure 4.
Impact of the Pandemic across Industries
Notes: Industries are ranked from lowest- to highest-paying based on their mean wage in January and February 2020; see Table A.2 for details. The figure plots the estimated coefficient from Equation (1) for each major industry category, indicating the impact of the pandemic on the dependent variable in April 2020 and February 2021 after controlling for seasonality and year fixed effects. The vertical lines represent 95% confidence intervals using robust standard errors.

