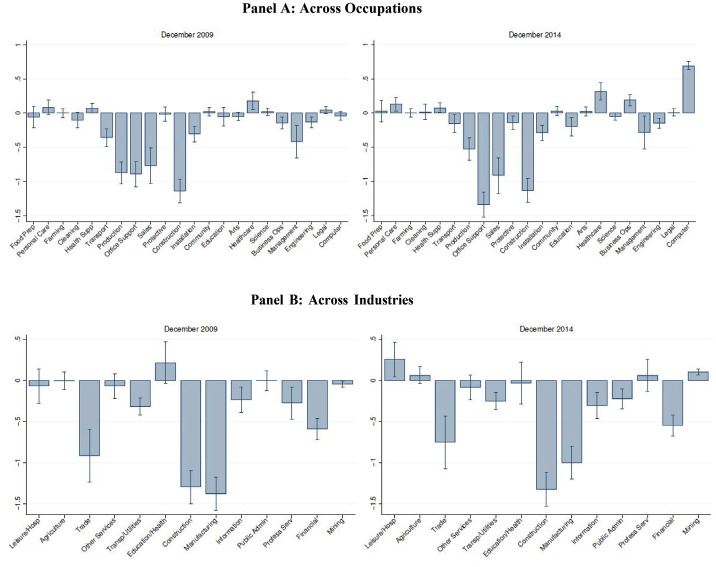
Figure 5.
Differential Changes in Employment Rates across Occupations and Industries during and after the Great Recession
Notes: Occupations and industries are ranked from lowest- to highest-paying based on their mean wage in January and February 2020. The figure plots the estimated coefficient from Equation (1) for each occupation or industry, using data for the period 2003–2014. The bars are estimates for the change in the employment rate of each occupation and industry as of December 2009 and December 2014, relative to 2007 levels, after controlling for seasonality effects. The vertical lines represent 95% confidence intervals using robust standard errors.

