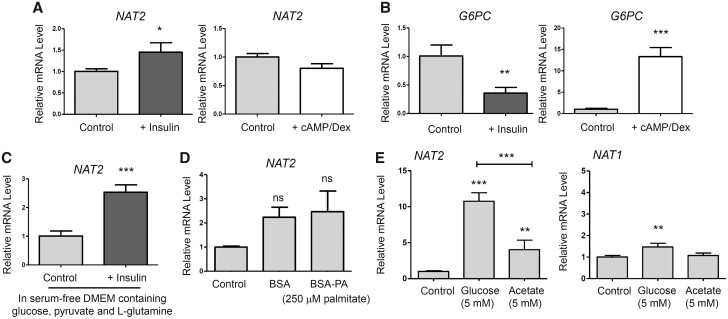
Figure 3.
Effect of insulin, cAMP/Dex, palmitate, or acetate on mRNA levels of NAT2, G6PC, and NAT1. A and B, HepG2 cells were cultured in the presence of insulin (100 nM) (+ Insulin) or 8-br-cAMP (500 µM) + dexamethasone (1 µM) (+ cAMP/Dex). DMEM free of d-glucose, pyruvate, l-glutamine, and FBS served as a treatment control (Control). C, HepG2 cells were cultured in serum-free DMEM containing d-glucose, pyruvate, and l-glutamine, plus insulin (100 nM) (+ Insulin) for 6 h. D, HepG2 cells were cultured in Control DMEM containing 0.5% BSA or 0.5% BSA-250 µM palmitate (BSA-PA) for 24 h. E, HepG2 cells were cultured in Control DMEM containing 5 mM d-glucose or 5 mM acetate for 24 h. Following the treatments, the relative mRNA level of the indicated gene (NAT2, G6PC, or NAT1) was measured by RT-qPCR using 18S ribosomal RNA as an internal control. Bar graphs represent mean ± SD (n = 4 per group). *, p < .05; **, p < .01; ***, p < .001. ns, not statistically significant. The asterisks located above the bars are for the comparison with the control DMEM treatment group (ie, Control), unless otherwise specified. The asterisks above the bracketed lines are for the comparison between 2 treatment groups.

