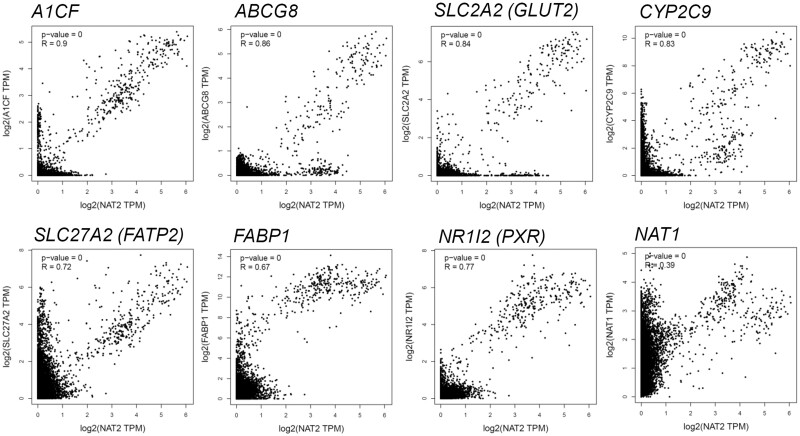
Figure 5.
Representative genes which are co-expressed with NAT2 among nondiseased human tissues. The dot plots show the mRNA levels (expressed in log2 of transcripts per kilobase million [TPM]) of NAT2 (x-axis) and the corresponding mRNA level of the gene of interest (eg, A1CF) (y-axis) in the same individual tissue samples. R, Pearson correlation coefficient. The analysis was done using tools available at GEPIA (Tang et al., 2017).

