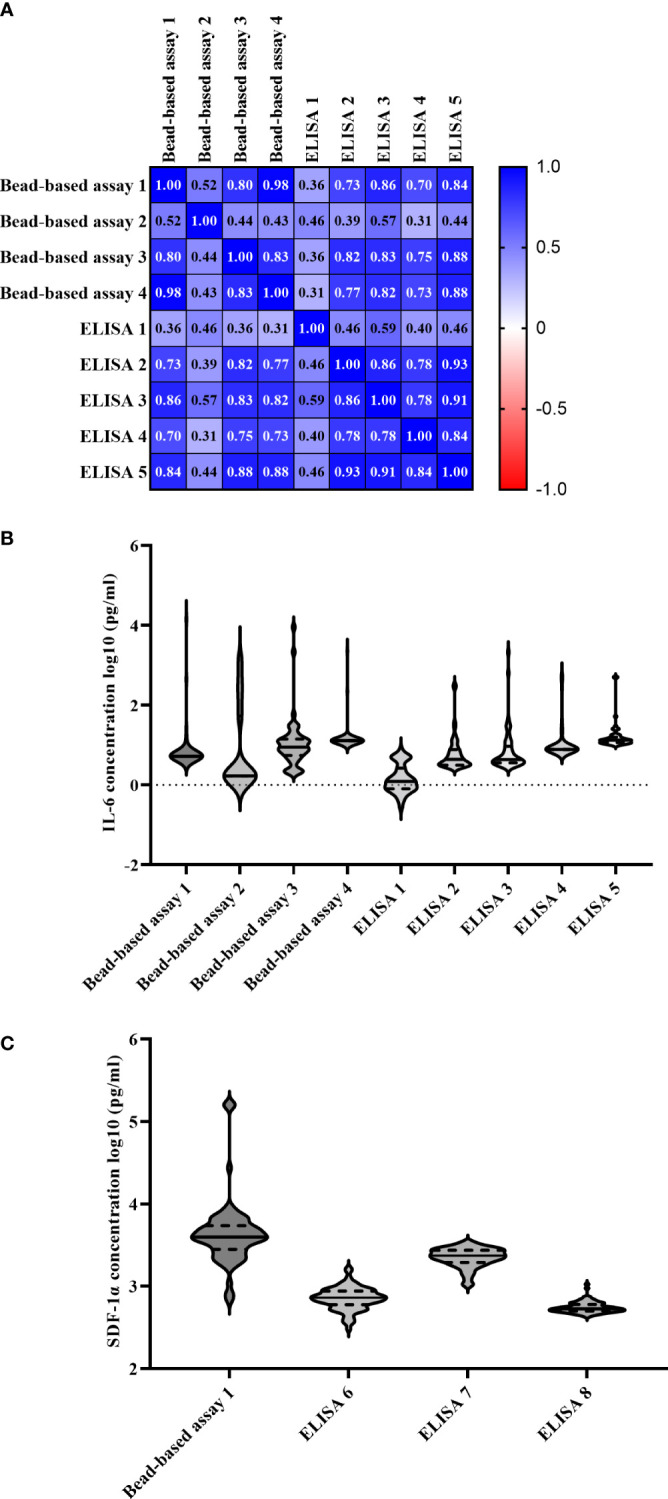
Figure 5.

Comparability of multiple bead-based assays and ELISAs measuring IL-6 and SDF-1α levels. (A) Pearson correlation matrix of different IL-6 measuring bead-based assays using 50 randomly selected samples. (B) IL-6 levels (log10-transformed, pg/ml) of individual samples measured on all assays. The black horizontal lines represent the median concentrations with quartiles labeled as dashed lines. (C) SDF-1α levels (log10-transformed, pg/ml) of individual samples measured on all assays. The black horizontal lines represent the median concentrations with quartiles labeled as dashed lines. IL, interleukin; MOGAD, myelin oligodendrocyte glycoprotein associated disease; MS, multiple sclerosis; NMOSD, neuromyelitis optica spectrum disorder; SDF, stromal cell-derived factor.
