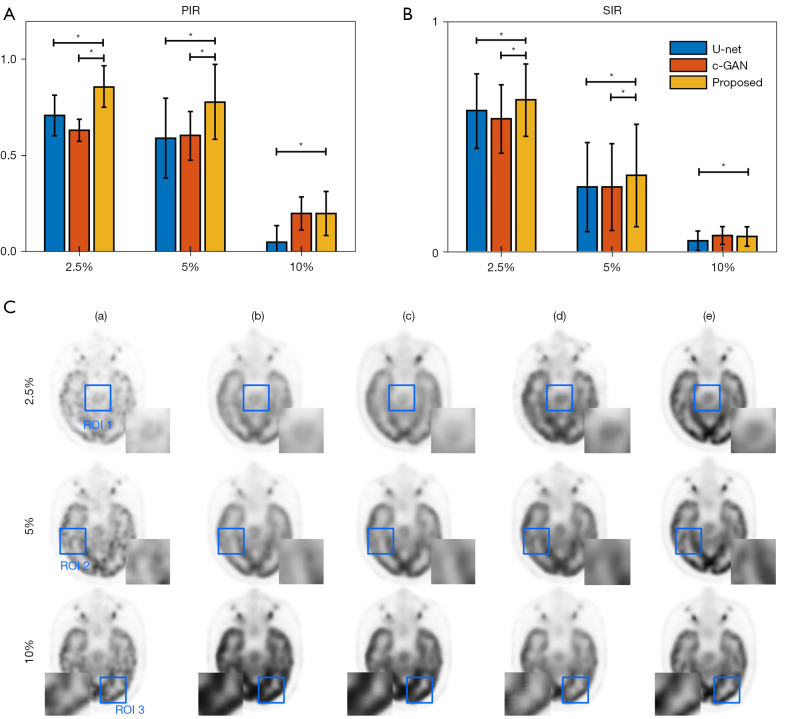
Figure 10.
Hold-out validation’s statistical results and visual examples. (A) and (B) are statistical results (mean ± standard deviation) from comparisons using U-net, c-GAN, and the proposed method to improve different initial low-dose PET images of 2.5%, 5%, and 10%: (A) PIR; (B) SIR. The proposed method is compared with two other methods. * indicates a significant result (P<0.05). (C) A visual example is a visual example of different methods’ synthesized results using different levels’ low dose PET inputs: (a) low-dose PET inputs of 2.5%, 5% and 10%; (b) U-net; (c) c-GAN; (d) proposed method; (e) full-dose PET. Three regions of interests are marked by blue boxes. PIR, improvement ratio of peak signal-to-noise ratio; SIR, improvement ratio of structural similarity; PET, positron emission tomography; c-GAN, conditional generative adversarial network.

