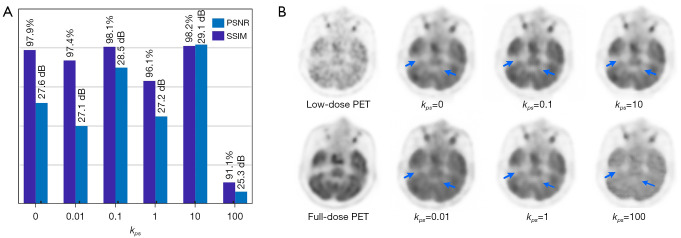
Figure 6.
The effects of different bias loss weights on synthesized results. (A) The quantitative comparisons of PSNR and SSIM when using different bias loss weighs (kps), the chosen kps values here are 0, 0.01, 0.1, 1, 10 and 100. (B) Visual examples of one slice’s synthesized results when using these different bias loss weighs. The first column contains input (5% low-dose PET image) and label (full-dose PET image), and other columns are synthesized images in which the first row appears better than the second row. In two regions of interest which are marked in blue arrows, bad results indicate a lack of details. PSNR, peak signal-to-noise ratio; SSIM, structural similarity; PET, positron emission tomography.

