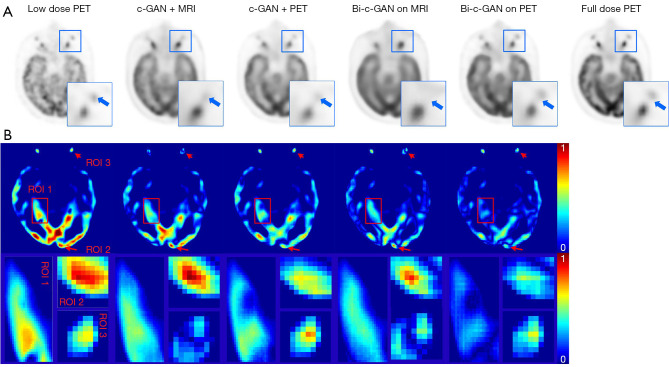
Figure 7.
The effects of different conditional inputs on synthesized results. (A) Visual examples and their ROIs of one axial slice’s generating results using different kinds of conditional inputs, the first image is 5% low dose PET image act as original state of PET here, the last image is full dose PET image act as ground truth here, other images here are synthesized results using different models, from left to right: c-GAN conditioned on MRI (c-GAN+MRI); c-GAN conditioned on PET (c-GAN+PET); bi-c-GAN with primary task conditioned on MRI (bi-c-GAN on MRI); bi-c-GAN with primary task conditioned on PET (bi-c-GAN on PET); a ROI is selected from the right upside of the image, which contains two sets of black matters. (B) Error maps of corresponding images in (A). The differences have been normalized to (0, 1), as depicted by the color bars in the right side of error map; blue means a small difference, and red means a large difference. ROI 1 is a large region in the middle of image which marked by red boxes; ROI 2 and 3 are small regions in images’ top and bottle which are marked by red arrows. PERT, positron emission tomography; ROI, region of interest; c-GAN, conditional-generative adversarial network; Bi-c-GAN, bi-task c-GAN; PET, positron emission tomography; MRI, magnetic resonance imaging.

