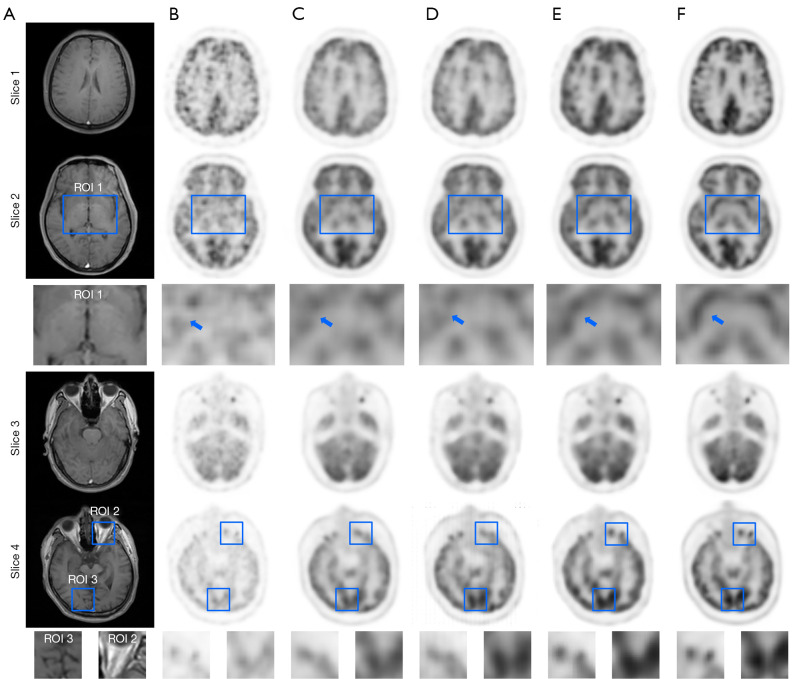
Figure 9.
Visual examples of the synthesized PET images by using different methods. Column (A) is T1-weighted MRI; column (B) is 5% low-dose PET images; columns (C), (D) and (E) are synthesized results from U-net, c-GAN, and the proposed method; the last column (F) is the full-dose PET image. Slice 1 to slice 4 are four selected axial parts of the head as shown in Figure 4. Three ROI are also listed in the bottom of slice 2 and slice 4. In ROI 1, a blue arrow was also used to mark one set of black matter. ROI, region of interest; MRI, magnetic resonance imaging; PET, positron emission tomography.

