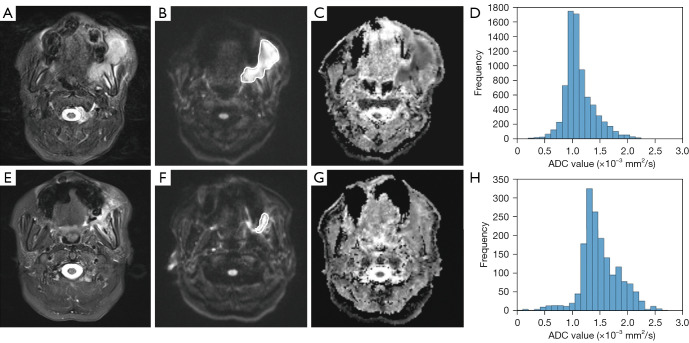
Figure 2.
A responder of 75-year-old woman with histologically proven left buccal cancer. (A-D) Before induction chemotherapy. (E-H) After one cycle of induction chemotherapy. (A) An axial T2-weighted image showing left buccal cancer with intermediate signal intensity. (B) The corresponding DWI image with the identical lesion for the reconstruction of ADC measurements. (C) The corresponding ADC map with the identical lesion. (D) A whole-lesion histogram analysis based on the ADC map before induction chemotherapy. (E) An axial T2-weighted image showing shrinkage of left buccal cancer with intermediate signal intensity. (F) The corresponding DWI image with the identical lesion for the reconstruction of ADC measurements. (G) The corresponding ADC map with the identical lesion. (H) A whole-lesion histogram analysis based on the ADC map after one cycle of induction chemotherapy. DWI, diffusion-weighted magnetic resonance imaging; ADC, apparent diffusion coefficient.

