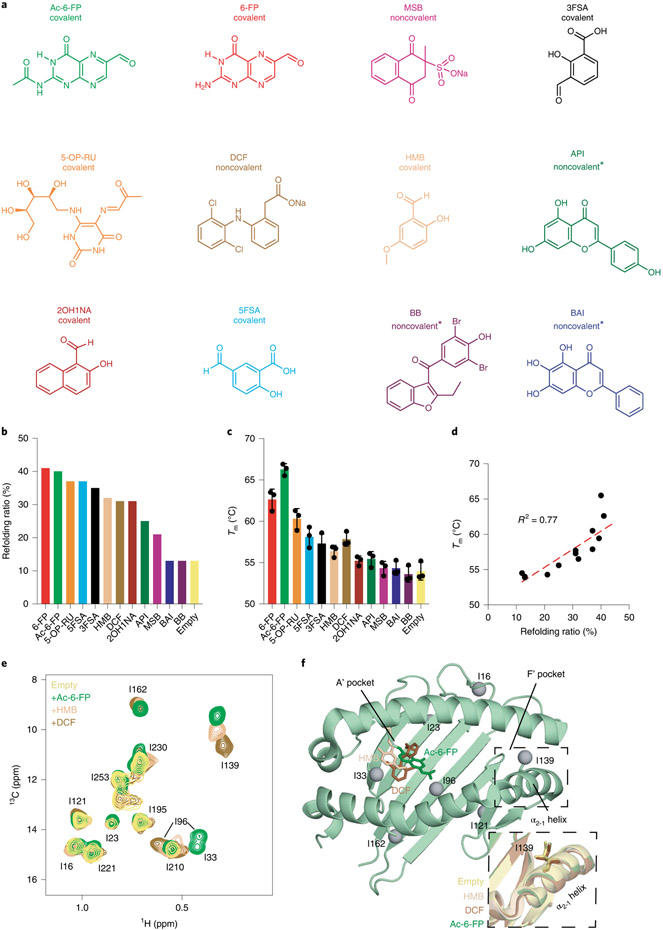
Fig. 1 ∣. Ligand dependence of MR1 stability and conformational plasticity.
a, Chemical structures of MR1 ligands tested. The status of linkage to MR1 K43 is noted as covalent (if Schiff base formed) or noncovalent (if unlinked). Full compound names are summarized in Supplementary Table 1. Metabolites with unknown linkages are noted with predicted linkages with asterisks (metabolites without a freely available aldehyde or ketone are not predicted to form Schiff base with the amine of MR1 K43). b, Refolding ratio (%) of properly folded hpMR1 relative to the aggregate peak obtained from SEC following in vitro refolding with bβ2m in the presence and absence (empty) of ligands. c, Melting temperature (Tm, °C) obtained from DSF of refolded empty and ligand-bound hpMR1/bβ2m. Data are mean ± s.d. for n = 3 technical replicates. d, Correlation plot of Tm versus refolding ratio. The coefficient of determination from linear regression (dotted line, R2) is shown. e, 2D 1H-13C HMQC spectra of 10 μM Ile 13Cδ1-labeled hpMR1 (natural isotopic abundance bβ2m) in the absence (empty) and presence of 2 mM Ac-6-FP, HMB or DCF added ligands, recorded at a 1H field of 600 MHz at 25 °C. All samples contain 0.5% DMSO-d6. f, Ile-δ1 methyl groups (gray spheres) mapped onto the MR1 groove. Ligands shown as sticks are Ac-6-FP (PDB ID 4PJ5, dark green, TCR removed), HMB (PDB ID 5U2V, beige, TCR removed) or DCF (PDB ID 5U1R, brown, TCR removed). The dotted box highlights the position of the I139 side chains (shown as sticks) in X-ray structures of different ligand-bound MR1 complexes relative to empty hMR1R9H (PDB ID 6W9V, yellow, TCR removed).

