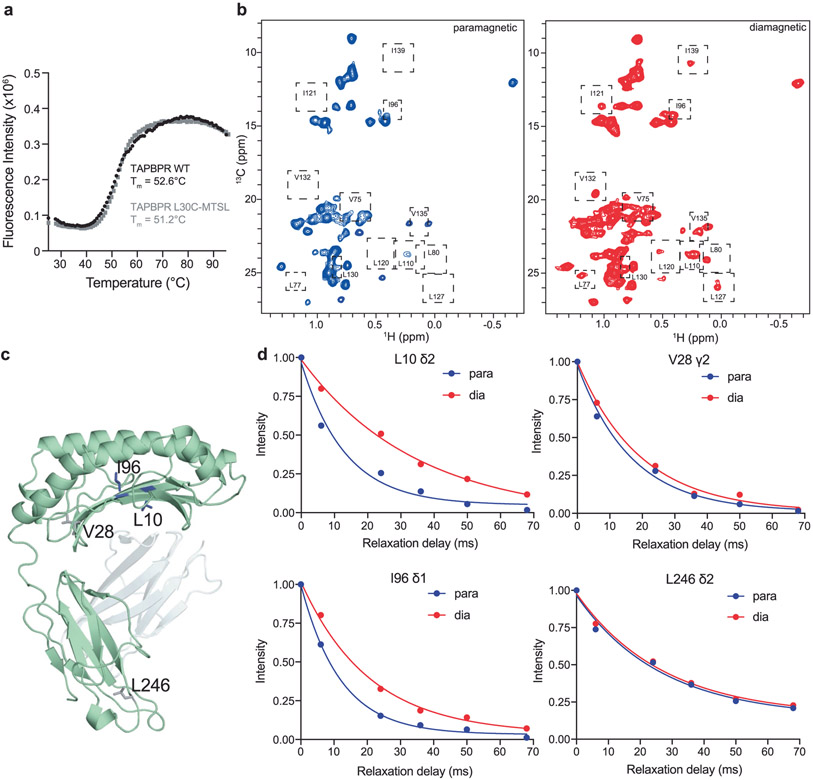
Extended Data Fig. 9 ∣. Measurement of 1HM-Γ2 PRE rates in the 89 kDa MR1/TAPBPR complex.
a, Melting temperature (Tm, °C) of TAPBPRWT (black) and TAPBPRL30C-MTSL (grey) obtained from differential scanning fluorimetry experiments. Data are mean ± SD for n = 3 technical replicates. b, 2D 1H-13C methyl HMQC spectra of 100 μM Ac-6-FP/ILVproS labeled hpMR1/bβ2m in complex with TAPBPRL30C-MTSL in the oxidized (paramagnetic, blue) or reduced (diamagnetic, red) state recorded at a 1H field of 600 MHz at 25 °C. Dotted boxes highlight a subset of the methyl resonances affected upon reduction of TAPBPRL30C-MTSL by ascorbic acid. c, Position of representative ILVproS methyl groups analyzed in panel d shown on the RosettaCM model of hpMR1 (PDB template 4PJ5, TCR removed). d, TAPBPRL30C-MTSL was complexed with Ac-6-FP/ILVproS hpMR1/bβ2m and 1HM R2 values were measured for oxidized (paramagnetic, blue) and reduced (diamagnetic, red) samples by recording a series of 2D methyl 1H-13C HMQC spectra and analyzing the NMR peak intensity as a function of a varied transverse relaxation delay (0, 6, 24, 36, 50 and 68 msec). The decay profiles for selected 1H methyl groups of L10 δ2, V28 γ2, I96 δ1 and L246 δ2 of hpMR1 are shown. A summary of all measured 1HM-Γ2 PRE rates is shown in Supplementary Table 5.

