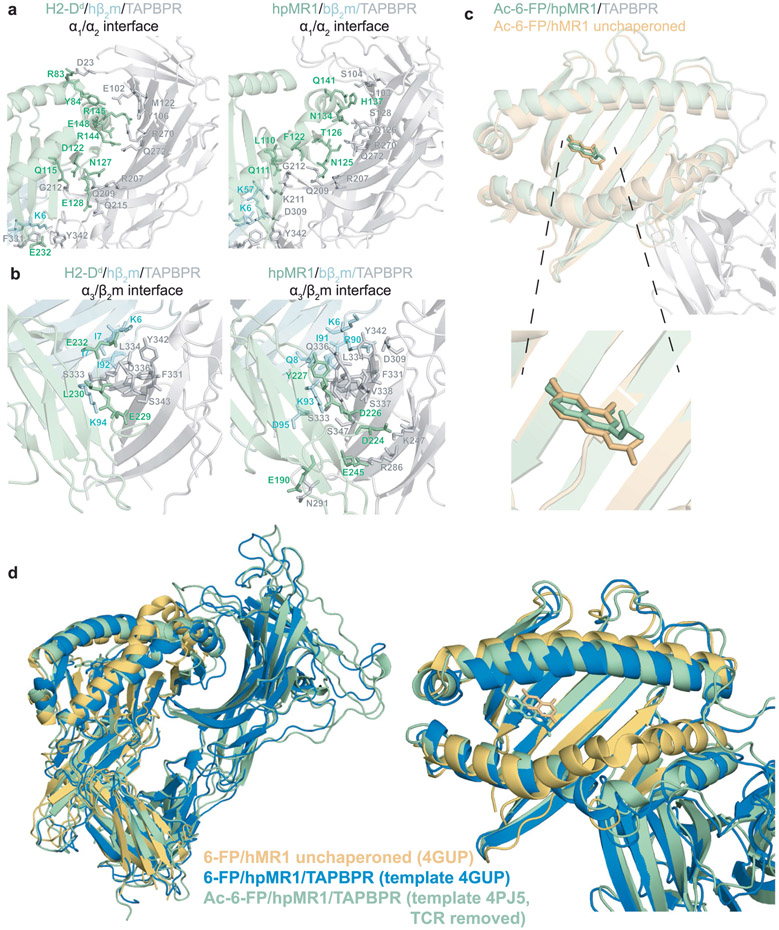
Extended Data Fig. 10 ∣. Comparison of the molecular interfaces of the TAPBPR bound MR1 versus MHC-I.
a, Interactions at the (Left) H2-Dd or (Right) hpMR1 α1/α2 interface with TAPBPR (TAPBPR in grey, H2-Dd or hpMR1 in green). The H2-Dd/TAPBPR interaction is shown for PDB ID 5WER, while the hpMR1/TAPBPR interaction is shown for the lowest energy hybrid NMR/MD model. Interacting residues are shown as sticks. b, Interactions at the (Left) H2-Dd or (Right) hpMR1 α3/β2m interface with TAPBPR (TAPBPR in grey, H2-Dd or hpMR1 in green; β2m in cyan). The H2-Dd/TAPBPR interaction is shown for PDB ID 5WER, while the hpMR1/TAPBPR interaction is shown for the lowest energy hybrid NMR/MD model. Interacting residues are shown as sticks. c, Overlay of Ac-6-FP in the hpMR1 groove for the TAPBPR chaperoned state (green, PDB 7RNO) versus Ac-6-FP in the hMR1 groove for the unchaperoned state (PDB ID 4PJ5, TCR removed). d, Structural overlays of unchaperoned 6-FP/hMR1 (PDB ID 4GUP, orange) compared with hybrid NMR/MD refined structures of Ac-6-FP/hpMR1/TAPBPR built using PDB ID 4PJ5, TCR removed (green) or 6-FP/hpMR1/TAPBPR built using PDB ID 4GUP (blue). The Cα RMSD between the green and blue structures is 1.769 Å.

