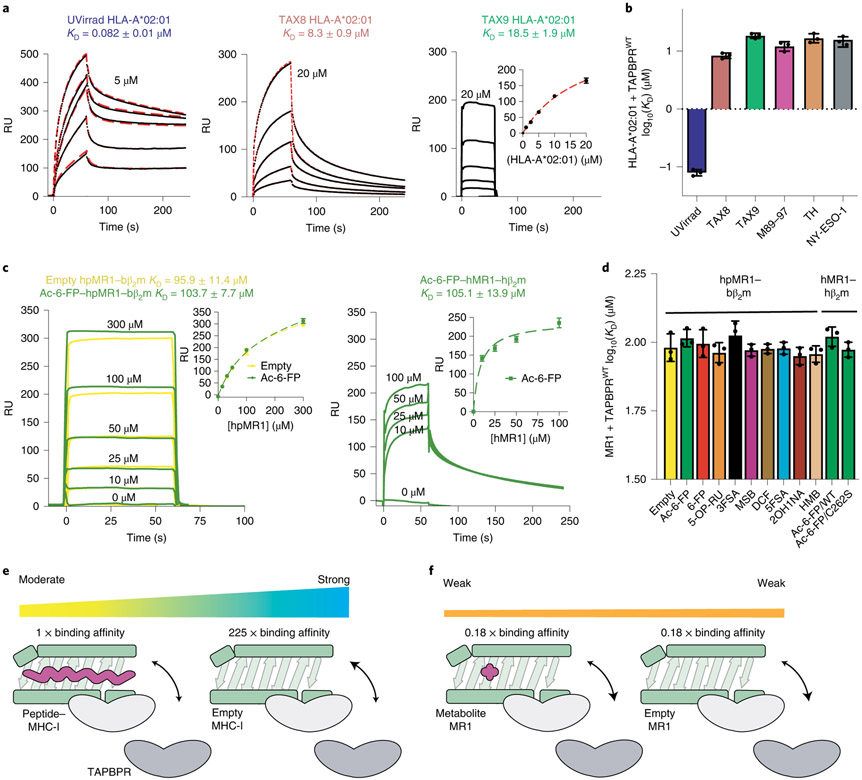
Fig. 2 ∣. Biochemical characterization of TAPBPR interactions with empty or loaded MHC-I versus MR1.
a, Representative SPR sensorgrams for varying concentrations of UV-irradiated HLA-A*02:01/hβ2m as well as non-UV-irradiated (UVirrad) TAX8/HLA-A*02:01/hβ2m and TAX9/HLA-A*02:01/hβ2m flowed over a streptavidin chip coupled with TAPBPRWT-biotin. The concentration of analyte for the top sensorgram is noted. Fits from surface bound (TAX9) or kinetic (TAX8, UVirrad A*02:01) analysis are shown with dotted red lines. Data are mean ± s.d. for n = 3 technical replicates. b, The log-scale comparison of SPR determined KD values for TAPBPRWT interacting with HLA-A*02:01 exhibiting different groove occupancies. Data are mean ± s.d. for n = 3 technical replicates. c, SPR sensorgrams for varying concentrations of (left) empty (yellow) or Ac-6-FP (green) loaded hpMR1–bβ2m and (right) Ac-6-FP loaded hMR1/hβ2m flowed over a streptavidin chip coupled with TAPBPRWT-biotin. The analyte concentration of each sensorgram is noted. The insets show fits from surface bound analysis. Data are mean ± s.d. for n = 3 technical replicates. d, The log-scale comparison of SPR determined KD values for TAPBPR interacting with hpMR1 exhibiting different groove occupancies. Also shown are KD values for TAPBPR interacting with Ac-6-FP bound wild-type (WT) or C292S hMR1. Data are mean ± s.d. for n = 3 technical replicates. e,f, Schematic summary of the fold change in affinity of TAPBPR for empty versus peptide-loaded MHC-I (e) or empty versus metabolite-loaded MR1 (f). 1× represents the measured affinity of TAPBPR for peptide/MHC-I.

