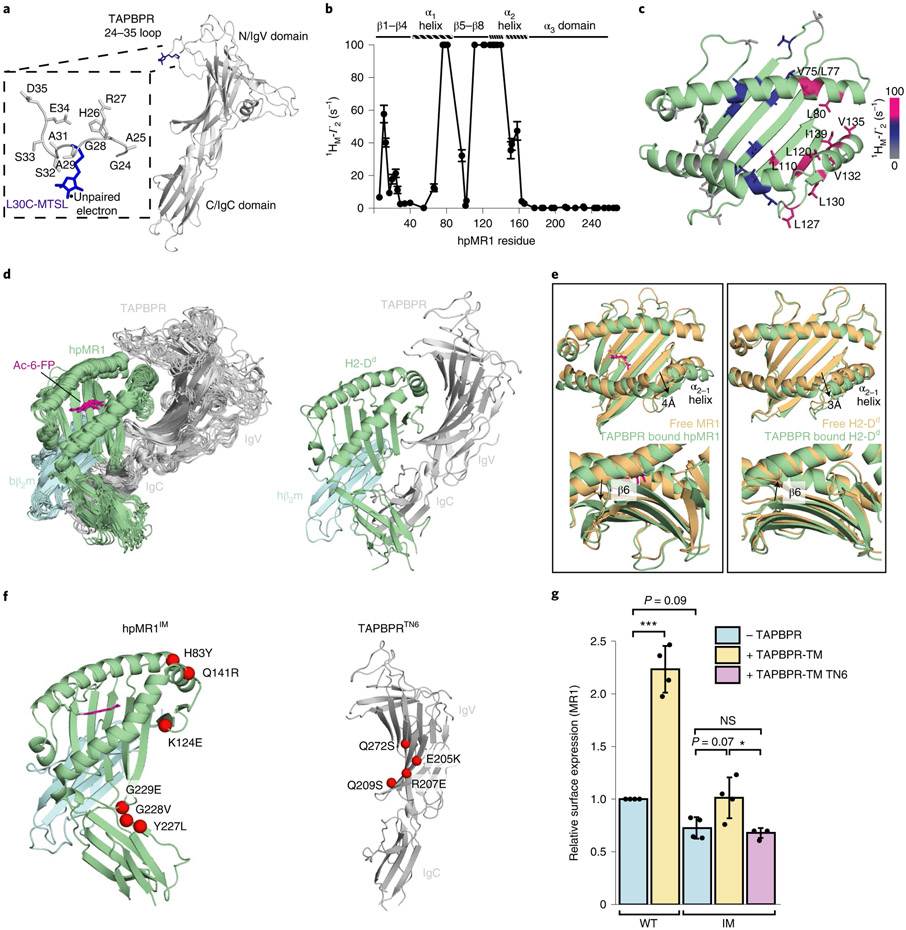
Fig. 5 ∣. Comparison of the molecular features of TAPBPR-bound MR1 versus MHC-I.
a, Structural model of L30C-MTSL in the TAPBPR G24-R36 loop. b, Intermolecular 1HM-Γ2 PRE rates (s−1) of ILVproS methyl resonances corresponding to hpMR1 residues while in complex with TAPBPRL30C-MTSL. PREs that are too large to measure accurately (> 100 s−1) are plotted at 100 s−1. Error bars were derived from five Monte Carlo fitting procedures. c, Intermolecular 1HM-Γ2 PRE rates (s−1) plotted onto a RosettaCM model of hpMR1–bβ2m (PDB template 4PJ5, TCR removed). PRE effects are color-coded on the basis of strength: 0–10 s−1 shown in gray, 10–60 s−1 in blue and ≥ 100 s−1 shown in warm pink. 1HM-Γ2 PRE rates are listed in Supplementary Table 5. d, Left, an ensemble of the ten lowest-energy structural models of the Ac-6-FP–hpMR1–bβ2m–TAPBPR complexes from restrained MD simulations and right, X-ray structure of the H2-Dd–hβ2m–TAPBPR complex (PDB ID 5WER). e, Superposition of the groove of free (orange) and TAPBPR-bound (green with Ac-6-FP in magenta) MR1 versus H2-Dd. Arrows denote (top) widening of the groove at the α2-1 helix and (bottom) rearrangement of the pleated β-sheet of the floor of the antigen binding groove. f, Mutant proteins used. Left, mutations on hpMR1 at TAPBPR interacting surfaces, resulting in the hpMR1IM construct. Right, mutations on TAPBPR at hpMR1 interacting surfaces, resulting in the TAPBPRTN6 construct. g, Surface expression of mutant MR1IM was poorly responsive to TAPBPR-TM coexpression. Data are mean ± s.d. from N = 4 independent experiments. Statistical significance was determined by one-way ANOVA with Tukey test: *P < 0.05, ***P < 0.001. A full list of P values is noted in the Methods.

