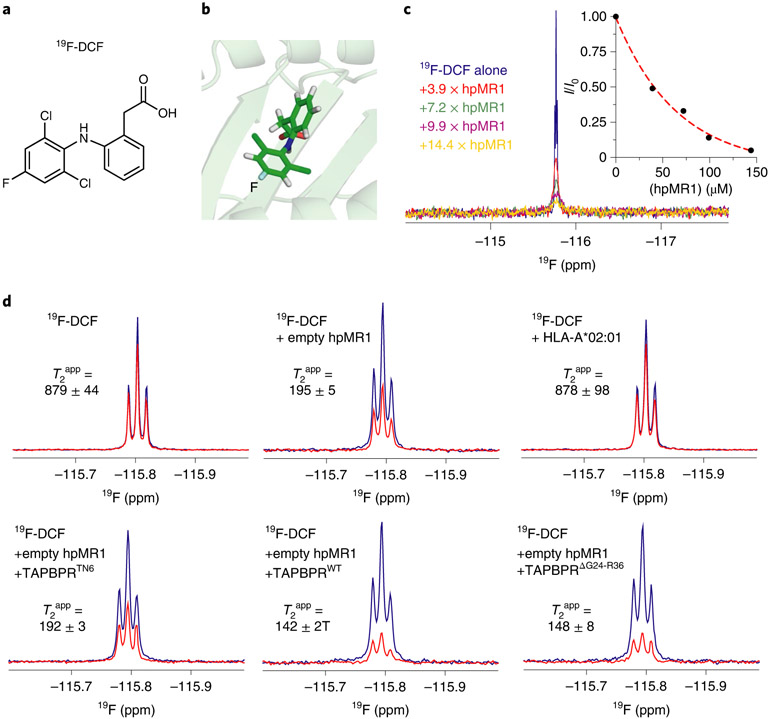
Fig. 6 ∣. TAPBPR influences ligand residence times in the MR1 groove.
a, Chemical structure of in-house synthesized 19F-DCF. b, Structural model of 19F-DCF in the hpMR1 groove (template PDB ID 5U1R, TCR removed). c, 1D 19F NMR spectra of 10 μM 19F-DCF titrated with increasing concentrations of empty hpMR1/bβ2m, recorded using a TCI probe without 1H decoupling. A plot of NMR signal intensity (I/I0) as a function of hpMR1 concentration is shown. Data were collected at 25 °C at a 1H field of 600 MHz. d, 1D 19F CPMG NMR spectra of 500 μM 19F-DCF in the presence or absence of 5 μM empty hpMR1-bβ2m or 5 μM UVirrad HLA-A*02:01–hβ2m. Also shown are experiments where 10 μM TAPBPRWT, TAPBPRTN6 or TAPBPRΔG24-R36 were added. The T2app values (ms) were estimated from Rint, which represents the change in NMR signal intensity between spectra acquired with short (80 ms CPMG duration, blue spectrum) versus long (240 ms CPMG duration, red spectrum) relaxation filters using a broadband 19F CPMG experiment collected at 25 °C at a 1H field of 600 MHz. The NMR signal is split because our NMR probe is not capable of performing simultaneous 19F detection and decoupling of nearby 1H spins.

