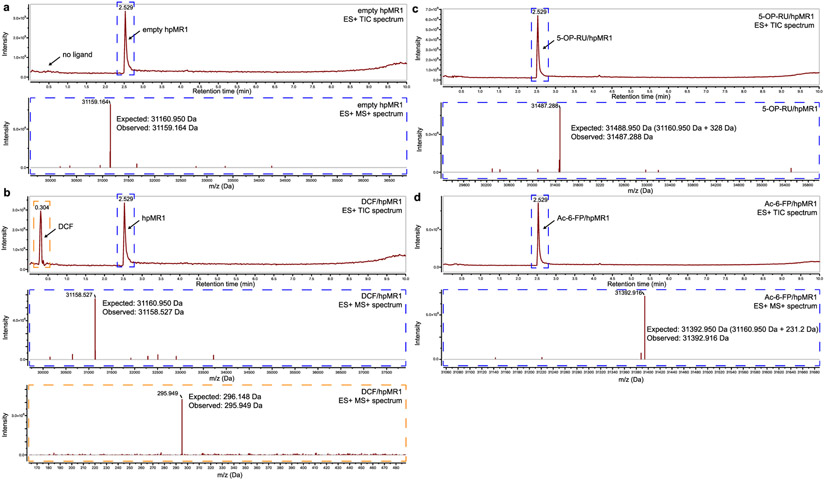
Extended Data Fig. 1 ∣. Mass spectroscopy characterization of empty and ligand bound hpMR1 states.
LC–MS analysis of purified a, empty hpMR1, b, DCF/hpMR1, c, 5-OP-RU/hpMR1, and d, Ac-6-FP/hpMR1 complexes. In each panel, the top graph shows the total ion chromatogram (TIC) while the bottom panel shows the deconvoluted m/z data (Da) of the selected TIC region highlighted in dotted boxes. The expected and observed molecular weights of each species are noted.

