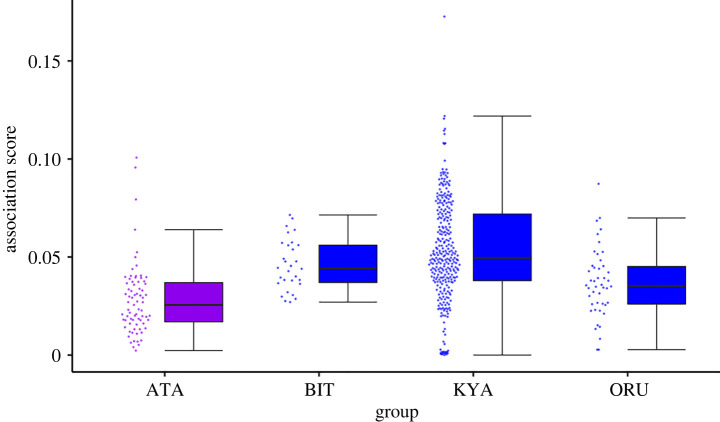
Figure 1.
The relationship between female dyadic association scores (y-axis) and gorilla group (x-axis: western gorilla = ATA (N = 75; purple) and mountain gorillas = BIT (N = 30), KYA (N = 310) and ORU (N = 46); blue). The dots represent the distribution of the raw data. See table 2 for the full results of the output of model 1 (N = 461 dyads). (Online version in colour.)

