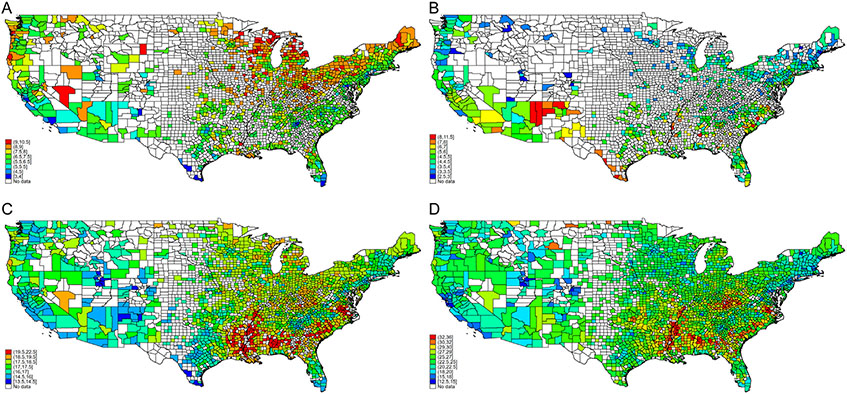
Figure 2.
County-level variability in esophagus (A), stomach (B), pancreas (C), and colorectal (D) cancer–related mortality rates, fully adjusted, 2010–2019. Mortality rates exclude counties with fewer than 20 observations because of unreliable estimates. Legend categories based on 1st, 5th, 10th, 25th, 50th, 75th, 90th, 95th, and 99th percentile of mortality. Mortality rates based on postestimation predictions of multivariable linear regression modeling.

