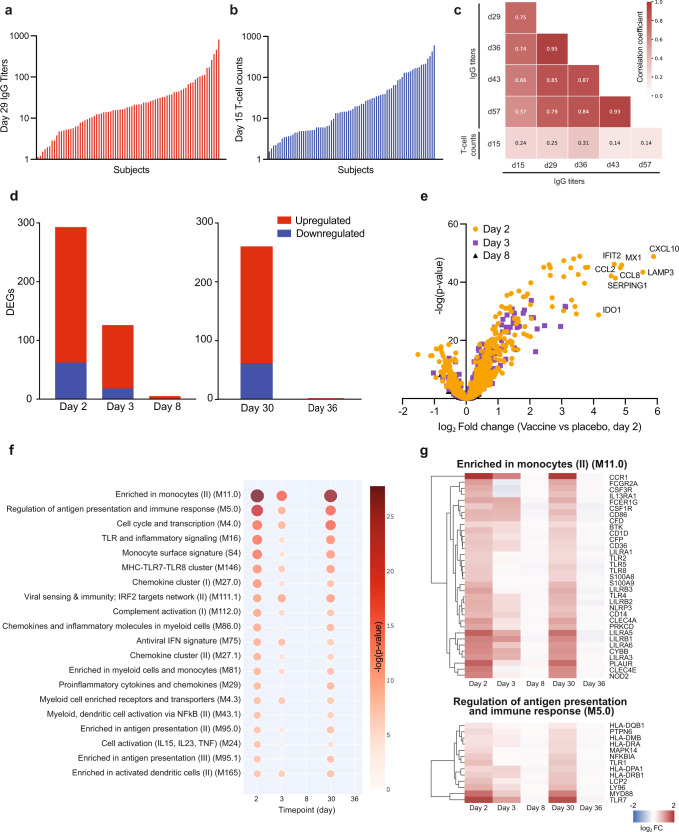
Fig. 1. ARCT-021 triggers an early induction of transcripts related to innate immune responses and antigen presentation.
a Day 29 IgG antibody titers and b Day 15 S-specific T cell responses in vaccinated individuals (n = 78), ranked from smallest to largest values. c. Correlation matrix showing the relationship of IgG titers (day 15, 29, 36, 43, 57) and day 15 S-specific T cell responses after ARCT-21 vaccination. The colour intensity is proportional to the correlation coefficient. d. Differentially expressed genes (DEGs) detected in all subjects receiving ARCT-021 (n = 78), as compared to the placebo group (n = 28) for day 2, 3, 8, 30 and 36. DEGs were identified based on fold-change >1.3 and false discovery rate-adjusted p value < 0.05 (Benjamini-Hochberg step-up procedure). Red bars indicate number of upregulated DEGs and blue bars indicate number of downregulated DEGs. e Volcano plot displaying genes that were most differentially expressed at day 2, 3 and 8 after vaccination. The most differentially regulated genes are annotated on the volcano plot. Volcano plot for day 30 and 36 are shown in Supplementary Fig. 1c. f Top 20 Blood Transcription Modules (BTMs) that are positively enriched (Benjamini-Hochberg adjusted p value < 0.05) at day 2, 3, 8, 30 and 36 in vaccinated subjects compared to placebo controls. Colour intensity and size of the dots is proportional to the −log10 transformed Benjamini-Hochberg adjusted p values. g Clustergram showing the log2-transformed fold-change of DEGs present in the top two BTM modules highlighted in f, “Enriched in monocytes (II) (M11.0)” and “Regulation of antigen presentation and immune response (M5.0)” at day 2, 3, 8, 30 and 36. The colour-gradient from blue to red indicates log2-transformed fold change (day 2/day 1) values from −2 to 2 respectively.

