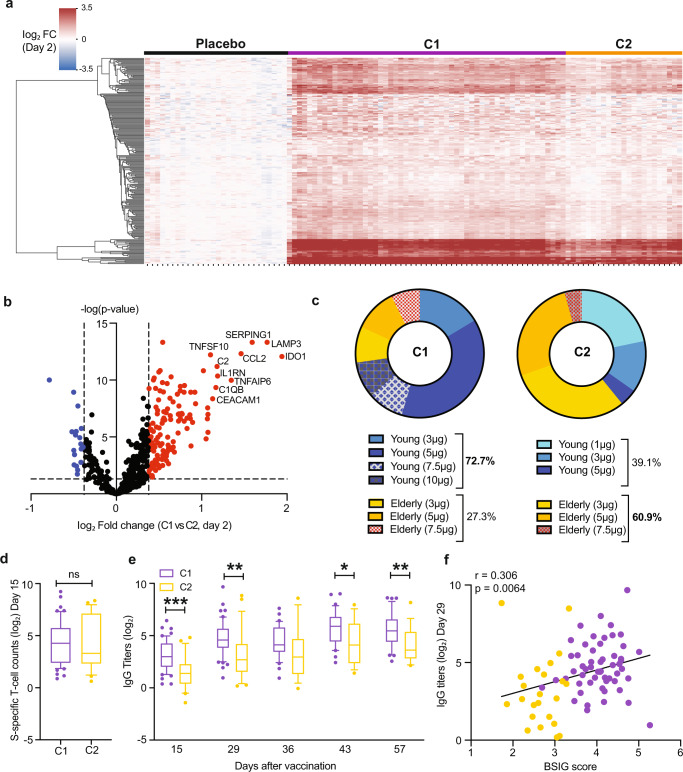
Fig. 2. Magnitude of induction of BSIG transcripts is positively correlated with humoral responses.
a Gene and sample hierarchical clustering based on expression profiles of upregulated DEGs on day 2. Three distinct sample clusters, named placebo, C1 (purple) and C2 (yellow) are detected. The colour-gradient from blue to red indicates log2-transformed fold change (day 2/day 1) values from −3.5 to 3.5 respectively. b. Volcano plot displaying genes that were most differentially expressed between C1 and C2 on day 2. The top 10 most differentially regulated genes are annotated on the volcano plot. Fold-change cut-off of 1.3 and Benjamini-Hochberg adjusted p-value 0.05 are indicated as dotted lines on the volcano plot. c. Donut plots showing the demographics of C1 and C2. Young and elderly subjects are highlighted in blue and yellow-orange respectively, with higher doses of vaccines indicated in darker colours. Overall percentages in the young and elderly subjects in C1 and C2 are also displayed. d. S-specific T-cell responses at day 15 post-vaccination in C1 (n = 55) and C2 (n = 23) clusters. e. Anti-S IgG titers (log2-transformed) of subjects in clusters C1 and C2 at day 15, 29, 36, 43 and 57 post-vaccination. For time-points from day 36 onwards, analysis is based on subjects who received the second dose of the vaccine. Box plots in d-e represent 25–75% intervals, with lines indicating medians. The whiskers represent 10–90% intervals. Unpaired, two-sided, Student’s t-tests were used for comparisons for d-e. f Pearson correlation of log2-transformed IgG titers at day 29 with BSIG score. BSIG score is calculated as the arithmetic mean of the top 10 genes that most distinctly separate C1 and C2, as indicated in b. *P < 0.05, **P < 0.01, ***P < 0.001.

