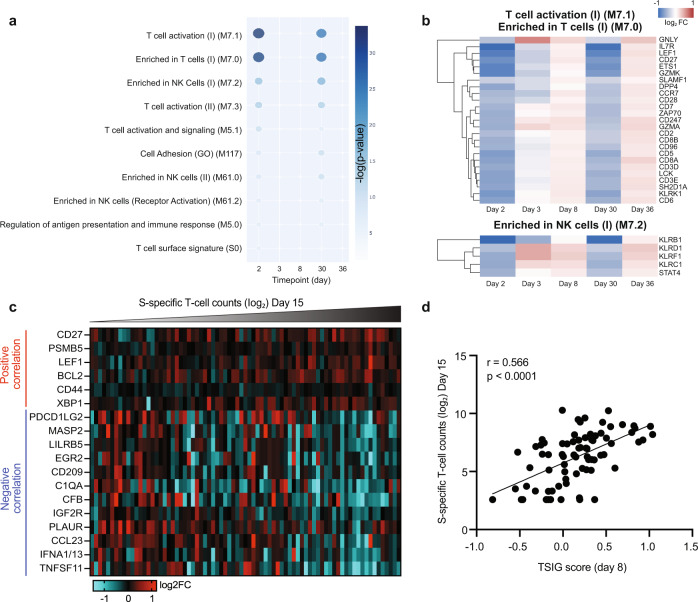
Fig. 3. Transcriptional correlates of spike-specific T cell responses are observed at day 7.
a Top 10 blood transcription modules (BTMs) that are negatively enriched (Benjamini-Hochberg adjusted p-value < 0.05) at day 2, 3, 8, 30 and 36 in vaccinated subjects compared to placebo controls. Colour intensity and size of the dots are proportional to the −log10 transformed Benjamini-Hochberg adjusted p-values. b Clustergram showing the log2-transformed fold-change of DEGs present in the top BTM modules highlighted in, “T-cell activation (I) (M7.1)”, “Enriched in T cells (I) (M7.0)” and “Enriched in NK cells (I) (M7.2)” at day 2, 3, 8, 30 and 36. The colour-gradient from blue to red indicates log2-transformed fold change (day 2/day 1) values from −1 to 1 respectively. c Heatmap showing day 8 transcripts that are significantly correlated (p-value < 0.05) with log2-transformed S-specific T cell counts at day 15 in ARCT-021 vaccinated individuals. Transcripts are ranked by Pearson correlation coefficient values. d. Pearson correlation of log2-transformed S-specific T cell counts at day 15 with TSIG score. TSIG score for each sample was calculated by subtracting the arithmetic log2 fold change values of the 12 negatively correlated genes from the 6 positively correlated genes shown in panel c.

