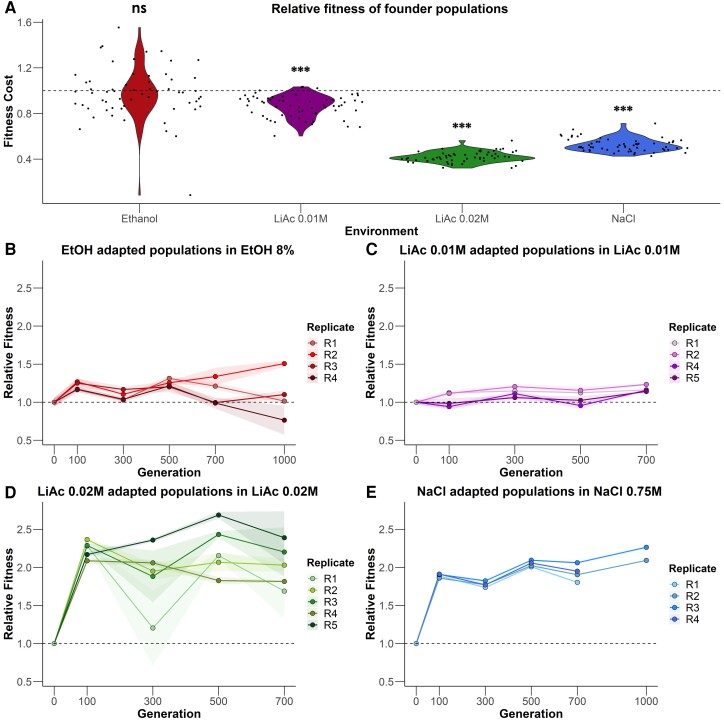
Fig. 2.
Fitness dynamics. (A) Founder population fitness (OD600 after 24 h of growth) in selective environments compared with growth in ancestral conditions (SC medium). Values of 1 (dashed horizontal line) indicate no change compared with ancestral conditions. Values below 1 indicate lower fitness in selective media, that is a fitness cost. Each black point represents a single measurement. (B–E) Mean relative fitness of replicate populations in the four selective environments. Shaded areas represent the 95% confidence intervals for each replicate population. One EtOH population went extinct in the first 100 generations. Type II ANOVA and Tukey HSD tests; n = 118 for NaCl, 236 for other environments, ***P < 0.001; ns = not significant.

